

Example of a bearish reversal signal AUDJPY 15-minute chart【RCI 3-line + BODSOR】
The figure below is the AUDJPY 15-minute chart.
AUDJPY 15-minute chart
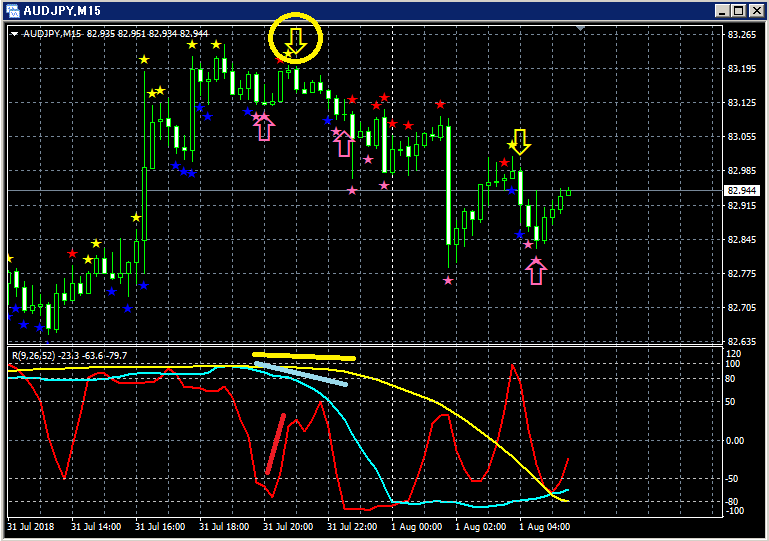
Upper section:BODSOR
Lower section: 3 lines of RCI (red: RCI9, light blue: RCI26, yellow: RCI52)
Sell-on-rally signal (yellow arrows enclosed in circles)
Among the three RCI lines, only RCI9 is clearly rising.
If RCI9 reverses and declines, there is a possibility that all three RCIs will head downward.
In other words, prices may also fall strongly.
In such a situation,BODSORsell-on-rally signal (yellow arrow) lights up.
Indicator that displays pullback buying and sell-on-rally signals 【BODSOR】
Twitter
https://twitter.com/RCIX3Line
Blog
http://bodsor.blog.fc2.com/
Investment Navigator+
https://fx-on.com/navi/serial/?id=359
YouTube
https://www.youtube.com/channel/UCL-g5uAlesiWVJEDtWlFvGw
Example of pullback buying and sell-on-rally signals on USD/JPY 1-hour chart
Note: For ease of explanation, some charts in this article may include added drawings such as circles, lines, or squares.
Thank you for understanding.


