

【RCI3 Three-Line+BODSOR】Switch from Accumulation/Buy on Dips to Rebound Sell - USD/JPY 15-minute Chart
The figure below is a 15-minute chart of USD/JPY.
USD/JPY 15-minute chart
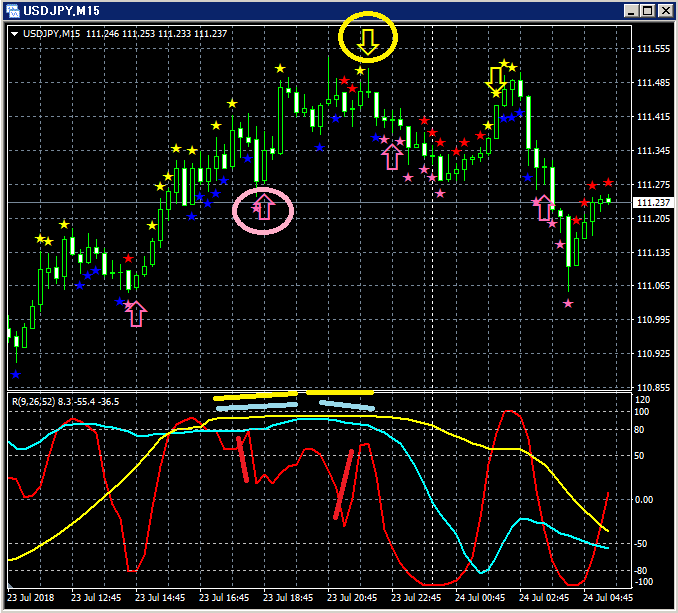
Upper section:BODSOR
Lower section: RCI three lines (red: RCI9, light blue: RCI26, yellow: RCI52)
(1) Buy on a dip signal (pink arrow circled)
Among the three RCI lines, only RCI9 is clearly declining.
If RCI9 reverses and rises, all three RCIs could rise together.
In other words, the price could rise strongly.
In such a situationBODSOR's buy-on-dip signal (pink arrow) lights up.
(2) Sell on a rally signal (yellow arrow circled)
Among the three RCI lines, only RCI9 is clearly rising.
If RCI9 reverses and falls, all three RCIs could decline together.
In other words, the price could fall strongly.
In such a situationBODSOR's sell-on-rally signal (yellow arrow) lights up.
Indicator that displays buy-on-dip and sell-on-rally signals【BODSOR】
Twitter
https://twitter.com/RCIX3Line
Blog
http://bodsor.blog.fc2.com/
Investment Navi+
https://fx-on.com/navi/serial/?id=359
YouTube
https://www.youtube.com/channel/UCL-g5uAlesiWVJEDtWlFvGw
Example of buy-on-dip and sell-on-rally signals on USD/JPY 1-hour chart
*In this article's charts, for convenience in explanations, things like circles, lines, and squares may be drawn.
Please be aware of this.


