

Example of a pullback buy signal for EUR/USD 1-hour chart [RCI 3-line + BODSOR]
The figure below is the EUR/USD 1-hour chart.
EUR/USD 1-Hour
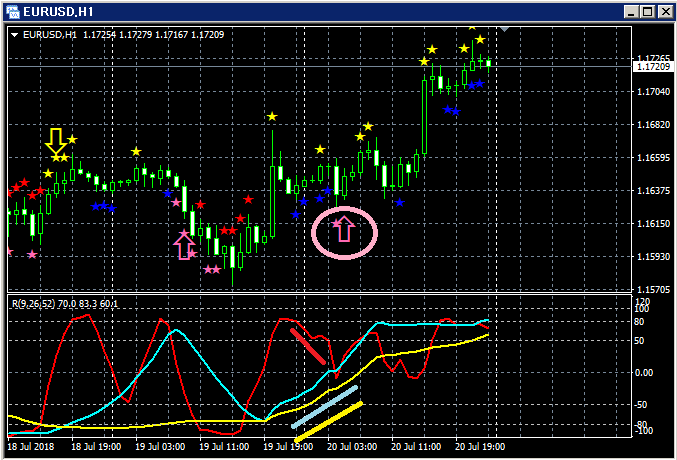
Upper panel:BODSOR
Lower panel: 3-line RCI (Red: RCI9, Light blue: RCI26, Yellow: RCI52)
Pullback Buy Signal (pink arrows in circles)
Of the three RCI lines, only RCI9 is clearly declining.
If RCI9 turns up, all three RCIs may rise together.
In other words, the price may rise sharply as well.
In such a situationBODSORpullback buy signal (pink arrow) lights up.
Afterward, the price rises significantly without updating the low of the candle on which the signal lit.
Indicator displaying pullback buy and pullback sell signals【BODSOR】
Twitter
https://twitter.com/RCIX3Line
Blog
http://bodsor.blog.fc2.com/
Investment Navigator+
https://fx-on.com/navi/serial/?id=359
YouTube
https://www.youtube.com/channel/UCL-g5uAlesiWVJEDtWlFvGw
USD/JPY 1-hour: Example of pullback buy and pullback sell signals
※In the charts in this article, for convenience, there might be added currency symbols, straight lines, triangles, and other shapes. Please understand.


