

Example of a selling signal (returning short) EUR/JPY 1-hour chart [RCI 3 lines + BODSOR]
The figure below is the EUR/JPY 1-hour chart.
EUR/JPY 1-hour chart
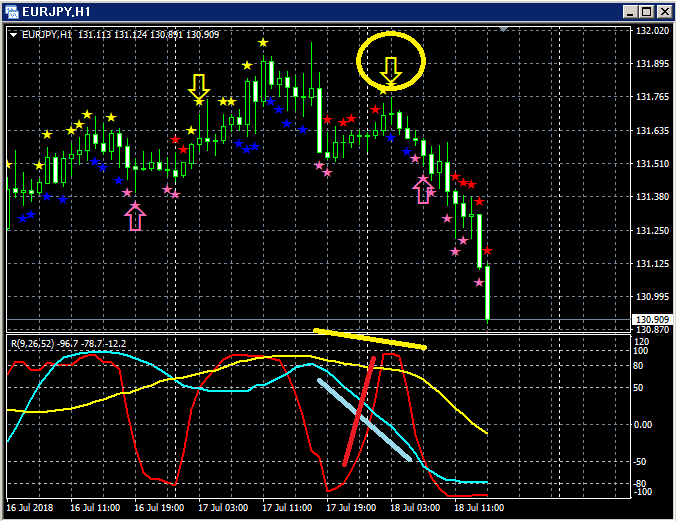
Upper panel:BODSOR
Lower panel: Three RCI lines (Red: RCI9, Light blue: RCI26, Yellow: RCI52)
Sell-on-rally signal (yellow arrows encircled)
Among the three RCI lines, only RCI9 is clearly rising.
If RCI9 turns downward, all three RCIs may turn downward together.
In other words, the price may also undergo a strong decline.
In such a situationBODSORsell-on-rally signal (yellow arrows) lights up.
Indicator to display pullback buying and sell-on-rally signals 【BODSOR】
Twitter
https://twitter.com/RCIX3Line
Blog
http://bodsor.blog.fc2.com/
Investment Navi+
https://fx-on.com/navi/serial/?id=359
YouTube
https://www.youtube.com/channel/UCL-g5uAlesiWVJEDtWlFvGw
Example of pullback buying and sell-on-rally signals on the USD/JPY 1-hour chart
*In the charts in this article, for convenience of explanation,円 (yen) and straight lines and rectangles may be drawn, etc., so please understand.
Please note.


