

【RCI3 Main Line + BODSOR】 Strong rise from the buying signal USD/JPY 1-hour chart
The figure below is the USD/JPY 1-hour chart.
USD/JPY 1-hour chart
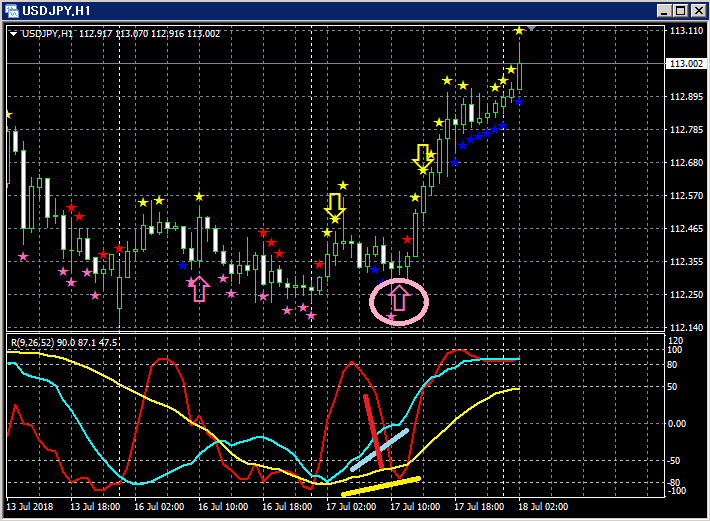
Upper section:BODSOR
Lower section: Three RCI lines (Red: RCI9, Light blue: RCI26, Yellow: RCI52)
Pullback buy signal (pink arrow circled)
Among the three RCI lines, only RCI9 is clearly declining.
If RCI9 turns upward, all three RCIs may rise together.
In other words, price may also rise strongly.
In such a situationBODSORpullback buy signal (pink arrow) lights up.
Indicator displaying pullback buy / pullback sell signals【BODSOR】
Twitter
https://twitter.com/RCIX3Line
Blog
http://bodsor.blog.fc2.com/
Investment Navigator Plus
https://fx-on.com/navi/serial/?id=359
YouTube
https://www.youtube.com/channel/UCL-g5uAlesiWVJEDtWlFvGw
Examples of pullback buy and rally sell signals on the USD/JPY 1-hour chart
Note: In the charts within this article, for convenience of illustration, there may be added circles, lines, or squares of yen, straight lines, or squares, so please understand.
Thank you for your understanding.


