

5-minute chart level [RCI three-line + BODSOR] example of a pullback sell signal, Pound-Dollar
The figure below is the Pound-Dollar 5-minute chart.
Pound-Dollar 5-minute Chart July 16, 2018
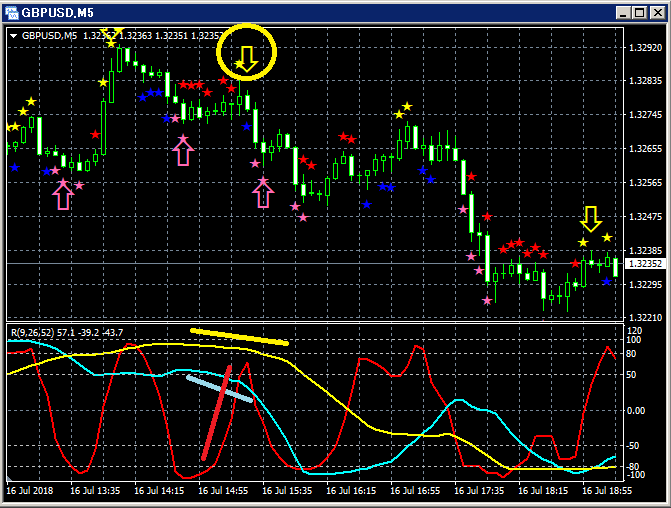
Upper level:BODSOR
Lower level: RCI three lines (red: RCI9, light blue: RCI26, yellow: RCI52)
Sell on rallies signal (yellow arrows circled)
Among the three RCI lines, only RCI9 is clearly rising.
If RCI9 reverses downward, all three RCI lines may move downward.
In other words, price could also fall strongly.
In such a situationBODSORsell on rallies signal (yellow arrows) lights up.
Indicator displaying pullback buying and rally selling signals 【BODSOR】
Twitter
https://twitter.com/RCIX3Line
Blog
http://bodsor.blog.fc2.com/
Investment Navigator+
https://fx-on.com/navi/serial/?id=359
YouTube
https://www.youtube.com/channel/UCL-g5uAlesiWVJEDtWlFvGw
Examples of pullback buying and rally selling signals on USD/JPY 1-hour chart
* In this article, for convenience of explanation, there may be additions of circles, straight lines, squares, etc. on the charts.
Thank you for your understanding.


