

Indicator that displays an arrow when 2 or 3 RCI lines are aligned
(1)
Indicator that displays an arrow when at least the directions of RCI9 and RCI26 among the three RCI lines align
The figure below is the 1-hour chart of USD/JPY.
USD/JPY 1-hour chart
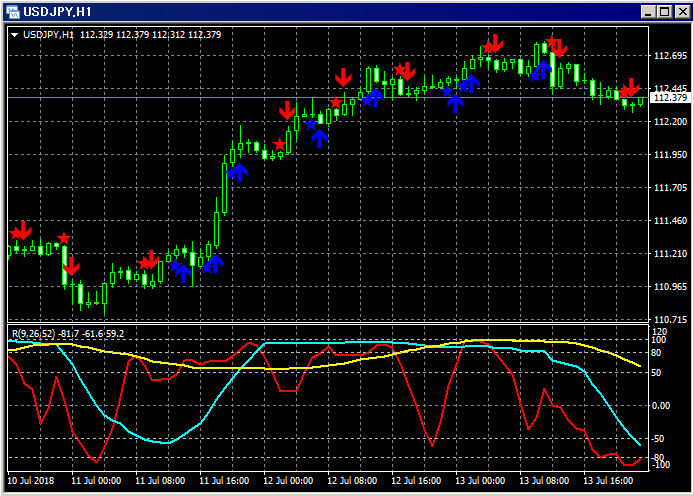
Lower section: three RCI lines (red: RCI9, light blue: RCI26, yellow: RCI52)
Upper section: Indicator that displays an arrow when the directions of RCI9 and RCI26 align
From a state where the directions of RCI9 and RCI26 are not aligned upward, when the directions align upward, first display a blue star. Then, at the open of the next bar, display a blue upward arrow.
From a state where the directions of RCI9 and RCI26 are not aligned downward, when the directions align downward, first display a red star. Then, at the open of the next bar, display a red downward arrow.
(2)
Indicator that displays an arrow when the directions of the three RCI lines (RCI9, RCI26, and RCI52) align
The figure below is the 1-hour chart of USD/JPY.
USD/JPY 1-hour chart
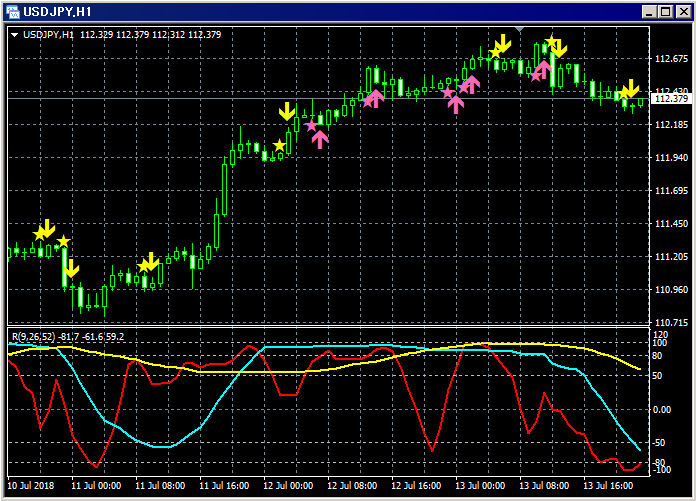
Lower section: three RCI lines (red: RCI9, light blue: RCI26, yellow: RCI52)
Upper section: Indicator that displays an arrow when the directions of the three RCI lines align
From a state where the directions of the three RCI lines do not align upward, when the three directions align upward, first display a pink star. Then, at the open of the next bar, display a pink upward arrow.
From a state where the directions of the three RCI lines do not align downward, when the three directions align downward, first display a yellow star. Then, at the open of the next bar, display a yellow downward arrow.


