

Indicator that displays an arrow when the three main lines' directions line up
An indicator that displays arrows when the three RCI lines alignhas been created.
The figure below is a EUR/USD 4-hour chart.
EUR/USD 4-hour chart
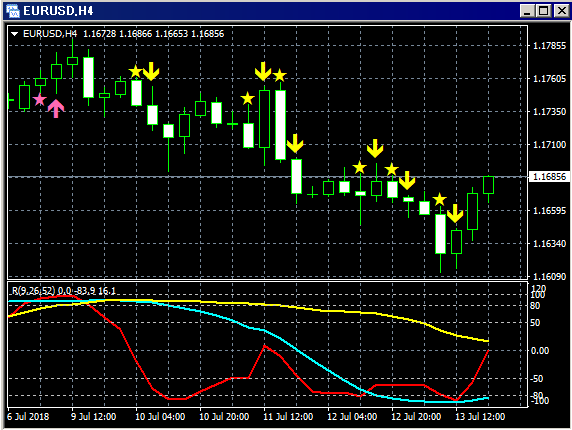
Lower section: RCI three lines (red: RCI9, light blue: RCI26, yellow: RCI52)
Upper section: Indicator that displays an arrow when the directions of the three RCI lines align
Starting from a state where the directions of the three lines are not aligned, when all three directions align upward, a pink star appears first. At the open of the next candle, a pink upward arrow is displayed.
From a state where the directions of the three lines are not aligned, when all three directions align downward, a yellow star appears first. At the open of the next candle, a yellow downward arrow is displayed.
I plan to verify various things in the future.
The chart below shows the frequently discussed“Three RCI lines + BODSOR”on a chart in the same time frame as above.
EUR/USD 4-hour chart
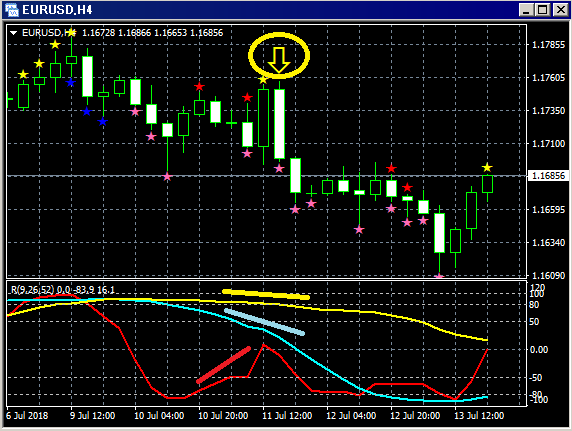
Upper section:BODSOR
Lower section: RCI three lines (red: RCI9, light blue: RCI26, yellow: RCI52)
Reversal-selling signal (yellow arrow enclosed in a circle)
Only RCI9 is clearly rising among the three RCI lines.
If RCI9 reverses downward, it could be a setup where all three RCIs align downward.
In other words, the price may also fall strongly.
In such a situation,BODSOR signals a reversal-selling signal (yellow arrow) lighting up.
Indicator that displays pullback buying and reversal-selling signals【BODSOR】
Twitter
https://twitter.com/RCIX3Line
Blog
http://bodsor.blog.fc2.com/
Investment Navigator+
https://fx-on.com/navi/serial/?id=359
YouTube
https://www.youtube.com/channel/UCL-g5uAlesiWVJEDtWlFvGw
EUR/USD 1-hour chart sample of pullback buying and reversal-selling signals
※In the charts in this article, for convenience of explanation, you may see annotations such as circles, lines, or rectangles drawn in.
Please note this.


