

Example of a reversal from selling after a pullback to buying on dips, viewed from the signal of 【RCI3 Three-Line+BODSOR】 Dollar/Yen 5-minute chart
The figure below is the USD/JPY 5-minute chart.
USD/JPY 5-minute chart
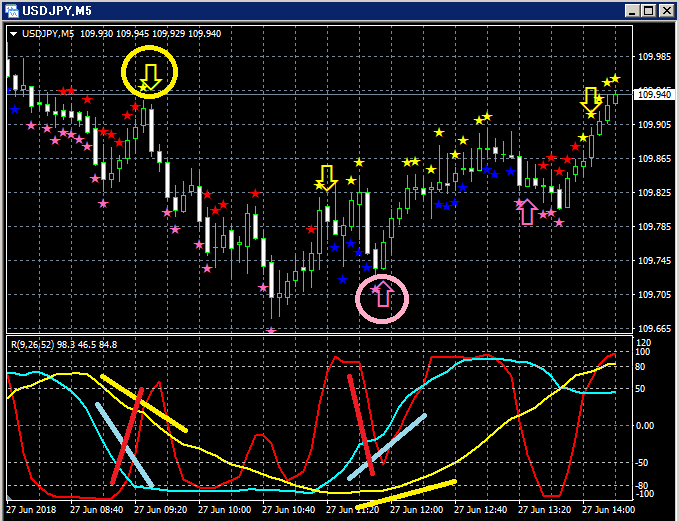
Top row:BODSOR
Bottom row: 3-line RCI (red: RCI9, light blue: RCI26, yellow: RCI52)
(1) Rebound selling signal (yellow arrow circled)
Among the three RCI lines, only RCI9 is clearly rising.
If RCI9 turns downward, all three RCIs may decline together.
In other words, prices may fall strongly as well.
In such a situationBODSORrebound selling signal (yellow arrow) lights up.
(2) Buy-on-dips signal (pink arrow circled)
Among the three RCI lines, only RCI9 is clearly falling.
If RCI9 turns upward, all three RCIs may rise together.
In other words, prices may rise strongly as well.
In such a situationBODSORbuy-on-dips signal (pink arrow) lights up.
Indicator that shows buy-on-dips and rebound selling signals【BODSOR】
Twitter
https://twitter.com/RCIX3Line
Blog
http://bodsor.blog.fc2.com/
Investment Navigator+
https://fx-on.com/navi/serial/?id=359
YouTube
https://www.youtube.com/channel/UCL-g5uAlesiWVJEDtWlFvGw
Example of buy-on-dips and rebound selling signals on the 1-hour chart of USD/JPY
Note: In this article’s charts, for convenience of explanation, circles, lines and squares may be drawn, etc., so please understand that.
.


