

Pattern where you aim for a pullback buy on the 1-hour chart when the 4-hour chart is displaying a very strong shape — AUDUSD [RCI 3-line + BODSOR]
AUDUSD 4-hour chart
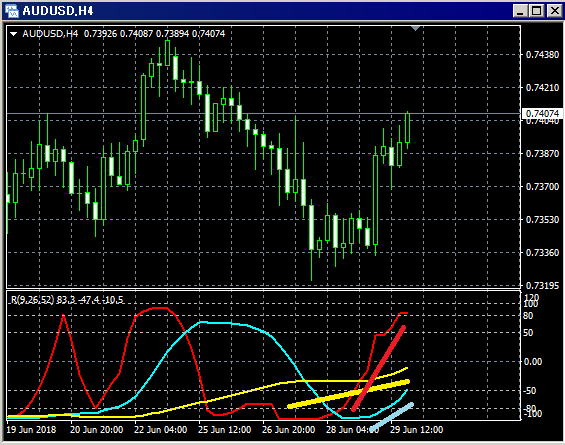
Lower section: RCI three lines (red: RCI9, light blue: RCI26, yellow: RCI52)
On the 4-hour chart, the three RCI lines are all rising together, forming a very strong pattern, so targeting a pullback on the 1-hour chart???
AUDUSD 1-hour chart
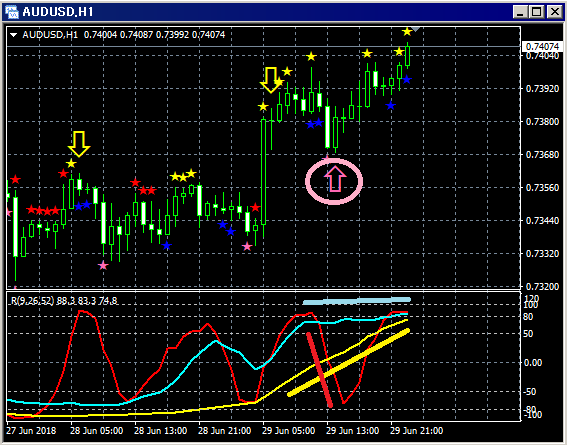
Upper section:BODSOR
Lower section: RCI three lines (red: RCI9, light blue: RCI26, yellow: RCI52)
Pullback buying signal (pink arrows circled)
Among the three RCI lines, the only clearly descending one is RCI9.
If RCI9 reverses and turns upward, all three RCIs could rise together.
In other words, the price may also rise strongly.
In such a situation,BODSOR pullback buying signal (pink arrows) lights up.
Immediately after the signal lights, a solid bullish candlestick forms. Subsequently, it rises smoothly, making new highs.
Indicator that displays pullback buy and retracement sell signals【BODSOR】
Twitter
https://twitter.com/RCIX3Line
Blog
http://bodsor.blog.fc2.com/
Investment Navigator Plus
https://fx-on.com/navi/serial/?id=359
YouTube
https://www.youtube.com/channel/UCL-g5uAlesiWVJEDtWlFvGw
Example of pullback buy / retracement sell signals on USD/JPY 1-hour chart
Note: In this article’s charts, for convenience of explanation, yen marks, straight lines, and squares may be drawn, so please understand.
.


