

【RCI3 Three-Line + BODSOR】Example of a returning sell signal EUR/USD 15-minute chart
The figure below is the Euro-Dollar 15-minute chart.
Euro-Dollar 15-minute chart
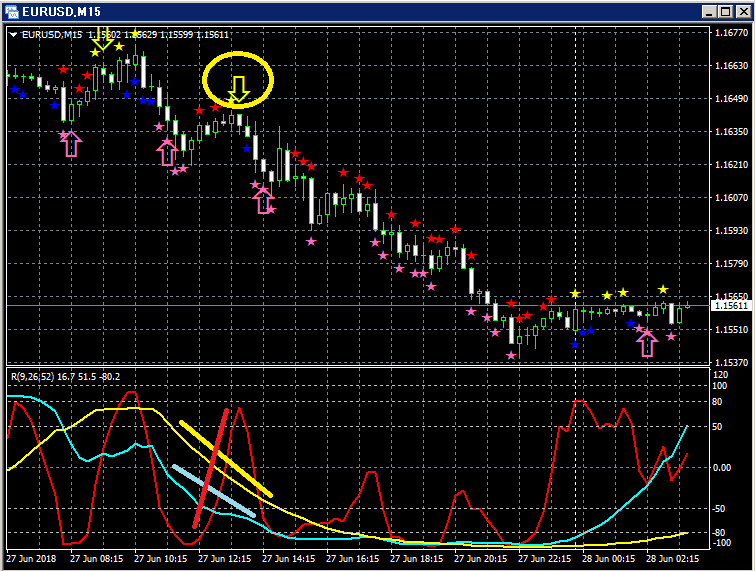
Upper panel:BODSOR
Lower panel: Three RCI lines (red: RCI9, light blue: RCI26, yellow: RCI52)
Reversal sell signal (yellow arrows circled)
Among the three RCI lines, only RCI9 is clearly rising.
If RCI9 turns downward, there is a possibility that all three RCIs will trend downward.
In other words, the price may also fall strongly.
In such a situationBODSORreversal sell signal (yellow arrows) lights up.
Indicator that displays pullback buying and reversal selling signals【BODSOR】
Twitter
https://twitter.com/RCIX3Line
Blog
http://bodsor.blog.fc2.com/
Investment Navi+
https://fx-on.com/navi/serial/?id=359
YouTube
https://www.youtube.com/channel/UCL-g5uAlesiWVJEDtWlFvGw
Examples of pullback buying and reversal selling signals on the 1-hour chart of USD/JPY
Note: For convenience of explanation, some charts in this article may include added circles, lines, or rectangles for illustration purposes, so please understand.
.


