

[RCI3 single line + BODSOR] Example of a pullback buying signal USDJPY 5-minute chart
The figure below shows the USDJPY 5-minute chart.
USDJPY 5-minute chart
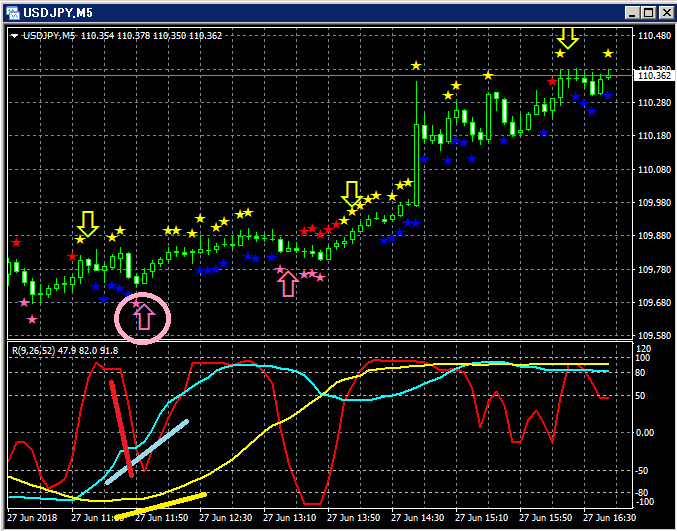
Top section:BODSOR
Bottom section: three RCI lines (Red: RCI9, Light Blue: RCI26, Yellow: RCI52)
Pullback Buy Signal (pink arrow encircled)
Among the three RCI lines, only the RCI9 is clearly descending.
If RCI9 reverses and rises, there is a possibility that all three RCIs rise together.
In other words, the price could also rise strongly.
In such a situationBODSOR pullback buy signal (pink arrow) lights up.
Indicator displaying pullback buy and pullback sell signals 【BODSOR】
Twitter
https://twitter.com/RCIX3Line
Blog
http://bodsor.blog.fc2.com/
Investment Navigator+
https://fx-on.com/navi/serial/?id=359
YouTube
https://www.youtube.com/channel/UCL-g5uAlesiWVJEDtWlFvGw
Example of pullback buy and pullback sell signals on the USD/JPY 1-hour chart
※ In the charts within this article, for convenience of explanation, there may be added circles, lines, and rectangles, etc.,
so please understand.


