

[RCI3 One-Line + BODSOR] Example of a short entry signal (back sell) Dollar/Yen 5-minute chart
The figure below is a chart of USD/JPY on a 5-minute chart.
USD/JPY 5-minute chart
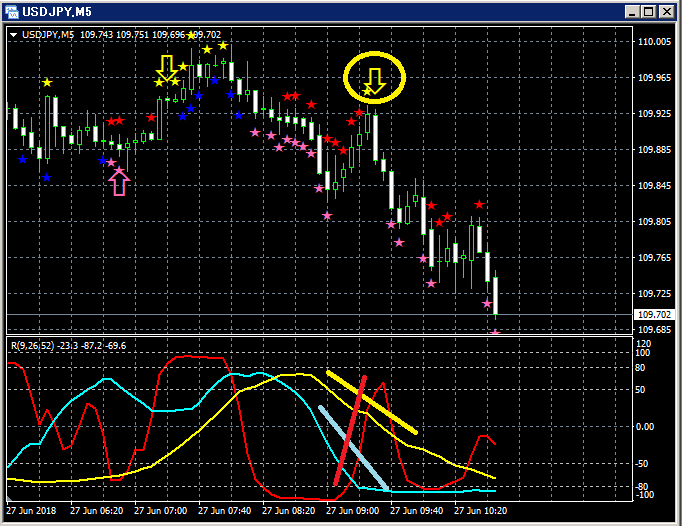
Top section:BODSOR
Bottom section: Three-line RCI (Red: RCI9, Blue: RCI26, Yellow: RCI52)
Reversal selling signal (yellow arrows circled)
Among the three RCI lines, only RCI9 is clearly rising.
If RCI9 reverses and falls, there is a possibility that all three lines will decline.
In other words, prices may also fall sharply.
In such a situationBODSORreversal selling signal (yellow arrows) lights up.
Indicator that displays pullback buying and reversal selling signals [BODSOR]
Twitter
https://twitter.com/RCIX3Line
Blog
http://bodsor.blog.fc2.com/
Investment Navigator Plus
https://fx-on.com/navi/serial/?id=359
YouTube
https://www.youtube.com/channel/UCL-g5uAlesiWVJEDtWlFvGw
Example of pullback buying and reversal selling signals on USD/JPY 1-hour chart
Note: For convenience of explanation, charts in this article may include additions such as yen marks, lines, or rectangles; please understand.


