

Example of a Sell Signal in Recoiled (returning) - USD/JPY 5-minute chart [RCI three lines + BODSOR]
The figure below is the USD/JPY 5-minute chart.
USD/JPY 5-minute chart
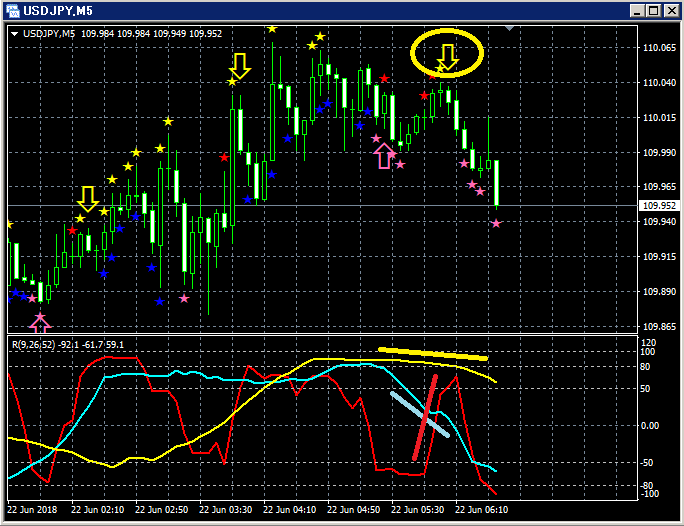
Upper panel:BODSOR
Lower panel: Three RCI lines (red: RCI9, light blue: RCI26, yellow: RCI52)
Sell-on-rebound signal (yellow arrow circled)
Among the three RCI lines, only RCI9 is clearly rising.
If RCI9 reverses and declines, there is a possibility that all three lines may decline.
In other words, the price may also fall strongly.
In such a situationBODSORSell-on-rebound signal for the pullback indicator (yellow arrow) lights up.
Indicator displaying pullback buying and sell-on-rebound signals 【BODSOR】
Twitter
https://twitter.com/RCIX3Line
Blog
http://bodsor.blog.fc2.com/
Investment Navigator Plus
https://fx-on.com/navi/serial/?id=359
YouTube
https://www.youtube.com/channel/UCL-g5uAlesiWVJEDtWlFvGw
Example of pullback buying and sell-on-rebound signals on the 1-hour chart of USD/JPY
*Some charts in this article may have added circles, lines, or rectangles for convenience of explanation, including yen marks, etc., so please understand this.
.


