

Example of a dip buy signal USDJPY 1-hour chart【RCI three lines + BODSOR】
The figure below is the USD/JPY 1-hour chart.
USD/JPY 1-hour chart
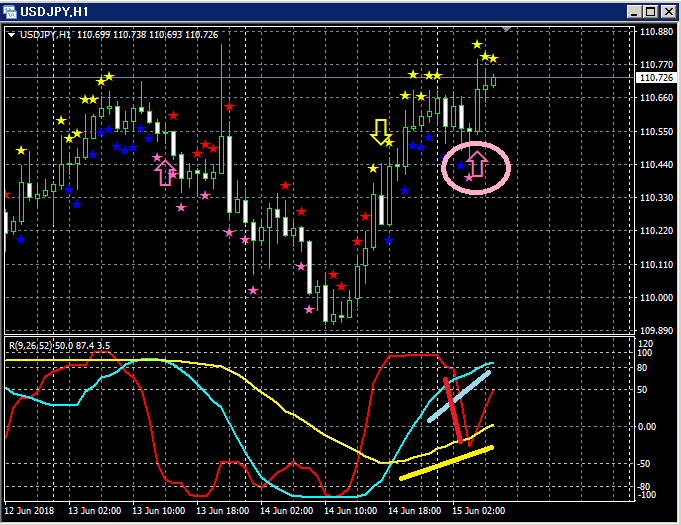
Top line:BODSOR
Bottom line: RCI three lines (red: RCI9, light blue: RCI26, yellow: RCI52)
Pullback buy signal (pink arrows circled)
Among the three RCI lines, only RCI9 is clearly descending.
If RCI9 reverses and starts rising, there is a possibility that all three RCIs will rise together.
In other words, the price could also rise strongly.
In such a situationBODSOR pullback buy signal (pink arrows) lights up.
Indicator that displays pullback buy and retracement sell signals [BODSOR]
Twitter
https://twitter.com/RCIX3Line
Blog
http://bodsor.blog.fc2.com/
Investment Navi+
https://fx-on.com/navi/serial/?id=359
YouTube
https://www.youtube.com/channel/UCL-g5uAlesiWVJEDtWlFvGw
An example of pullback buy and retracement sell signals on the USD/JPY 1-hour chart
*Please note that some charts in this article may include added circles, lines, or squares for convenience of explanation.
Thank you for your understanding.


