

Example of a pullback buy signal EURUSD 5-minute chart [RCI three lines + BODSOR]
The figure below is the EURUSD 5-minute chart.
EURUSD 5-minute chart
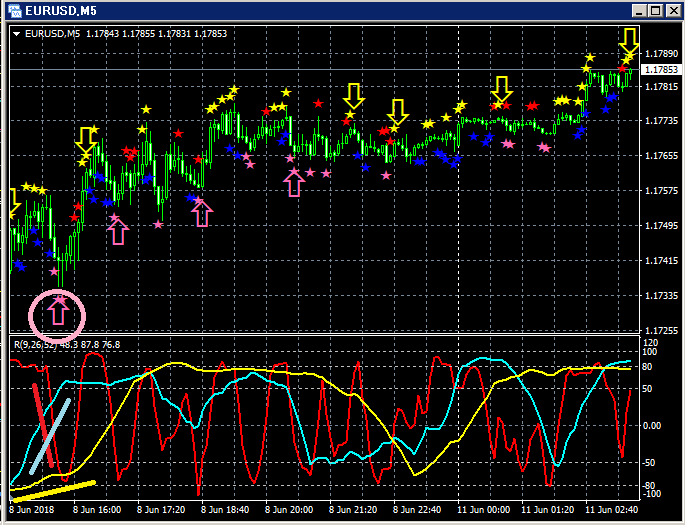
Upper row:BODSOR
Lower row: RCI three lines (red: RCI9, light blue: RCI26, yellow: RCI52)
Pullback Buy Signal (pink arrows circled)
Among the three RCI lines, only RCI9 is clearly descending.
If RCI9 turns upward, all three RCIs may rise together.
In other words, the price may also rise strongly.
In such a situationBODSORpullback buy signal (pink arrow) lights up.

Twitter
https://twitter.com/RCIX3Line
Blog
http://bodsor.blog.fc2.com/
Investment Navigator+
https://fx-on.com/navi/serial/?id=359
YouTube
https://www.youtube.com/channel/UCL-g5uAlesiWVJEDtWlFvGw
Example of pullback buy and reversal sell signals on USD/JPY 1-hour chart
Note: In the charts within this article, for convenience of explanation, you may see circles, straight lines, and squares added.
Please understand.


