

Example of a short sale signal — GBP/USD 5-minute chart [RCI 3-line + BODSOR]
The figure below is a 5-minute chart of the GBP/USD pair.
GBP/USD 5-minute chart
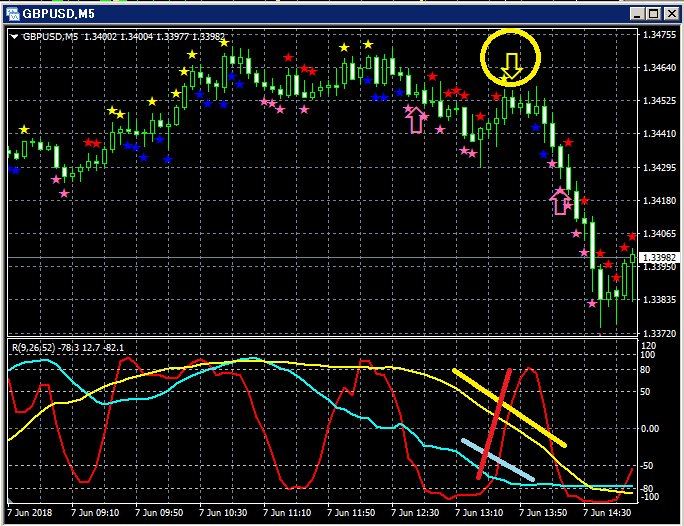
Upper section:BODSOR
Lower section: Three RCI lines (Red: RCI9, Light blue: RCI26, Yellow: RCI52)
Sell-on-rally signal (yellow arrows encircled)
Among the three RCI lines, only RCI9 is clearly rising.
If RCI9 reverses downward, there is a possibility that all three RCIs will move down together.
In other words, the price may also drop strongly.
In such a situationBODSORs buy-on-dip/sell-on-rally signal (yellow arrows) lights up.
Indicator showing buy-on-dip and sell-on-rally signals【BODSOR】
Twitter
https://twitter.com/RCIX3Line
Blog
http://bodsor.blog.fc2.com/
Investment Navi+
https://fx-on.com/navi/serial/?id=359
YouTube
https://www.youtube.com/channel/UCL-g5uAlesiWVJEDtWlFvGw
Example of buy-on-dip and sell-on-rally signals on the USD/JPY 1-hour chart
※In the charts within this article, for convenience of explanation, a few circles, lines, and rectangles may be drawn
as needed. Please understand.


