

Example of a dip-buy signal: EURUSD 1-hour chart [RCI three-line + BODSOR]
The figure below is the EURUSD 1-hour chart.
EURUSD 1-hour chart
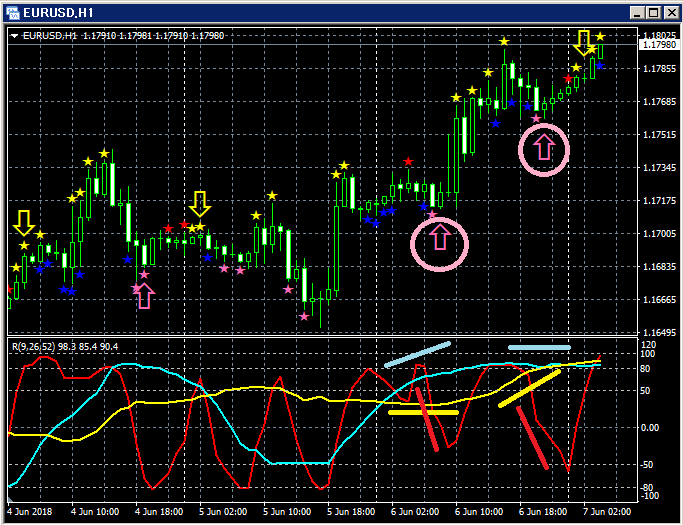
Top section:BODSOR
Bottom section: Three RCI lines (Red: RCI9, Light blue: RCI26, Yellow: RCI52)
Pullback Buy Signal (pink arrow circled)
Among the three RCI lines, only RCI9 is clearly moving downward.
If RCI9 reverses and rises, the three RCIs may all rise together.
In other words, there is a possibility of a strong price rise.
In such a situationBODSORpullback buy signal (pink arrow) lights up.
Indicator that displays pullback buy and retrace sell signals【BODSOR】
Twitter
https://twitter.com/RCIX3Line
Blog
http://bodsor.blog.fc2.com/
Investment Navigator+
https://fx-on.com/navi/serial/?id=359
YouTube
https://www.youtube.com/channel/UCL-g5uAlesiWVJEDtWlFvGw
Example of pullback buy and retrace sell signals on the USD/JPY 1-hour chart
*Please note that in this article’s chart, for convenience of explanation, circles, lines, and squares may be drawn.
Thank you for your understanding.


