

Sell the rebound after the US employment statistics?! [RCI three-line + BODSOR] Example of a bearish reversal signal USD/JPY 5-minute chart
The figure below is the USD/JPY 5-minute chart.
USD/JPY 5-minute chart
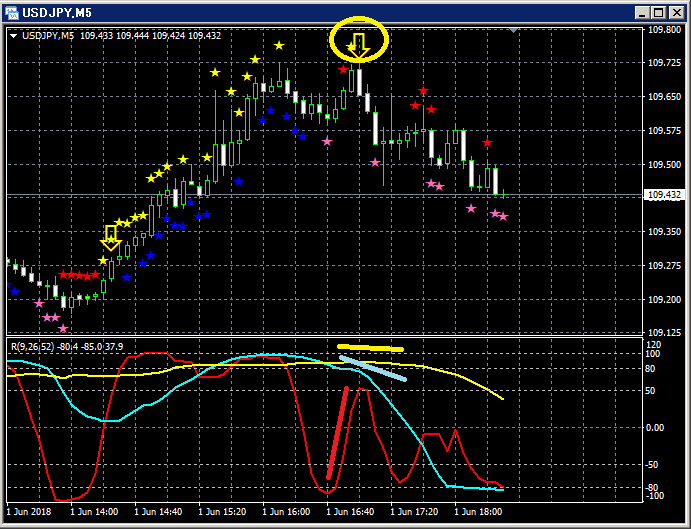
Top section:BODSOR
Bottom: RCI three lines (red: RCI9, light blue: RCI26, yellow: RCI52)
Sell against the trend signal (yellow arrows circled)
Among the three RCI lines, only RCI9 is clearly rising.
If RCI9 reverses and declines, all three RCIs may drop together.
In other words, price may also undergo a strong decline.
In such a situationBODSORsell-into-rally signal (yellow arrows) lights up.
Indicator displaying buy on dips and sell on rallies【BODSOR】
Twitter
https://twitter.com/RCIX3Line
Blog
http://bodsor.blog.fc2.com/
Investment Navigator+
https://fx-on.com/navi/serial/?id=359
YouTube
https://www.youtube.com/channel/UCL-g5uAlesiWVJEDtWlFvGw
Example of a pullback buy / sell-on-rallies signal on USD/JPY 1-hour chart
Note: In this article's charts, for ease of explanation, additions such as circles, lines, and rectangles may be drawn.
Please understand.


