

Example of a Sell Signal USD/JPY 1-minute Chart [RCI 3 Lines + BODSOR]
The figure below is the USD/JPY 1-minute chart.
USD/JPY 1-minute chart
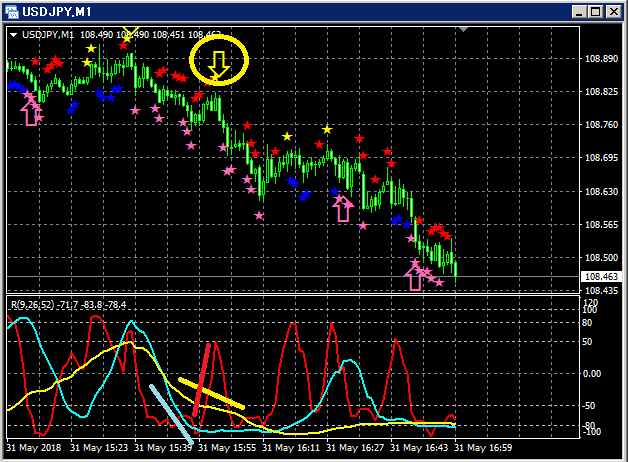
Top:BODSOR
Bottom: RCI three lines (red: RCI9, light blue: RCI26, yellow: RCI52)
Comeback Sell Signal (yellow arrows in circles)
Among the three RCI lines, only RCI9 is clearly rising.
If RCI9 reverses and falls, there is a possibility that all three RCIs will trend downward.
That is, the price may also experience a strong downward move.
In such a situationBODSORcomeback sell signal (yellow arrows) lights up.
Indicator that displays the dip-buying and comeback selling signals【BODSOR】
Twitter
https://twitter.com/RCIX3Line
Blog
http://bodsor.blog.fc2.com/
Investment Navi Plus
https://fx-on.com/navi/serial/?id=359
YouTube
https://www.youtube.com/channel/UCL-g5uAlesiWVJEDtWlFvGw
USD/JPY 1-hour chart: examples of dip-buying and comeback selling signals
*For convenience in explaining, the chart in this article may include additions such as circles, lines, and rectangles.
Please note.


