

Example of a bottom-buy signal USDJPY 5-minute chart【RCI three lines + BODSOR】
The figure below is a USD/JPY 5-minute chart.
USD/JPY 5-minute Chart
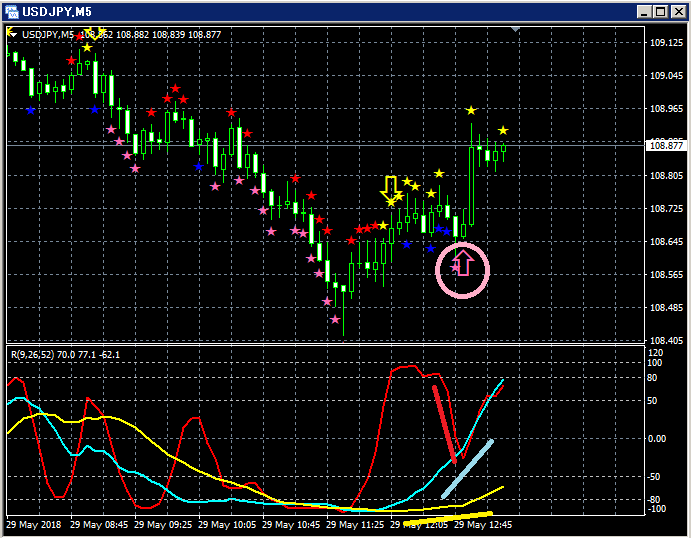
Upper: BODSOR
Lower: RCI three lines (red: RCI9, light blue: RCI26, yellow: RCI52)
Buy signal on a pullback (pink arrows circled)
Among the three RCI lines, only RCI9 is clearly declining.
If RCI9 reverses and rises, there is a possibility that all three RCIs rise together.
In other words, the price may also rise strongly.
In such a situation,BODSOR‘s pullback buy signal (pink arrow) lights up.
Indicator to display pullback buy and pullback sell signals【BODSOR】
Twitter
https://twitter.com/RCIX3Line
Blog
http://bodsor.blog.fc2.com/
Investment Navigator+
https://fx-on.com/navi/serial/?id=359
YouTube
https://www.youtube.com/channel/UCL-g5uAlesiWVJEDtWlFvGw
Examples of pullback buy and pullback sell signals on USD/JPY 1-hour chart
※For convenience in explanation, charts in this article may include additions such as circles, lines, and rectangles.
Please understand.


