

Example of a Sell Signal Returning USD/JPY 1-Minute Chart [RCI 3-Line + BODSOR]
The figure below is a USD/JPY 1-minute chart.
USD/JPY 1-minute chart
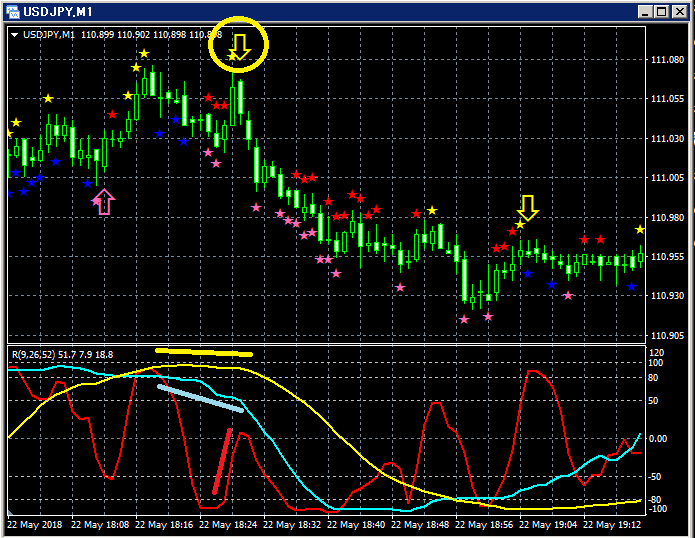
Upper panel:BODSOR
Lower panel: RCI three lines (Red: RCI9, Light blue: RCI26, Yellow: RCI52)
Reversal sell signal (yellow arrows enclosed in circles)
Among the three RCI lines, only RCI9 is clearly rising.
If RCI9 reverses and starts to fall, all three RCIs could turn downward.
In other words, price may fall strongly as well.
In this kind of situationBODSORreversal sell signal (yellow arrows) lights up.
Indicator that displays pullback buy / retracement sell signals【BODSOR】
Twitter
https://twitter.com/RCIX3Line
Blog
http://bodsor.blog.fc2.com/
Investment Navigator+
https://fx-on.com/navi/serial/?id=359
YouTube
https://www.youtube.com/channel/UCL-g5uAlesiWVJEDtWlFvGw
Example of pullback buy / retracement sell signals on USD/JPY 1-hour chart
*In the charts in this article, for convenience of explanation, you may see additions such as circles, lines, or rectangles drawn.
Please note.


