

Example of a short (reverse selling) signal GBPJPY 4-hour chart [RCI three lines + BODSOR]
The figure below is a recent GBP/JPY 4-hour chart.
GBP/JPY 4-hour
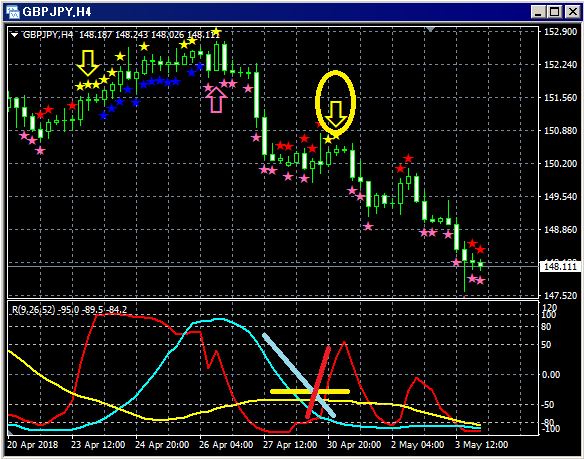
Upper panel:BODSOR
Lower panel: RCI three-line indicator (Red: RCI9, Light blue: RCI26, Yellow: RCI52)
Sell on rebound signal (yellow arrows circled)
Among the three RCI lines, only RCI9 is clearly rising.
If RCI9 reverses and declines, it could indicate that all three RCIs may turn down.
In other words, the price may also experience a strong decline.
In such a situationBODSORsell-on-rebound signal (yellow arrows) lights up.
Indicator displaying pullback buying and sell on rebound signals [BODSOR]
Twitter
https://twitter.com/RCIX3Line
Blog
http://bodsor.blog.fc2.com/
Investment Navigator+
https://fx-on.com/navi/serial/?id=359
YouTube
https://www.youtube.com/channel/UCL-g5uAlesiWVJEDtWlFvGw
Example of a pullback buying and sell on rebound signal on USD/JPY 1-hour chart
Note: In the charts within this article, for convenience of explanation, circles, lines, squares, and other shapes may be drawn in, so please understand.
.


