

Examples of Buy the Dip and Sell on Retracements signals: GBPUSD 5-minute chart [RCI 3 lines + BODSOR]
The figure below is the 5-minute chart of GBP/USD on May 2, 2018.
GBP/USD 5-minute chart
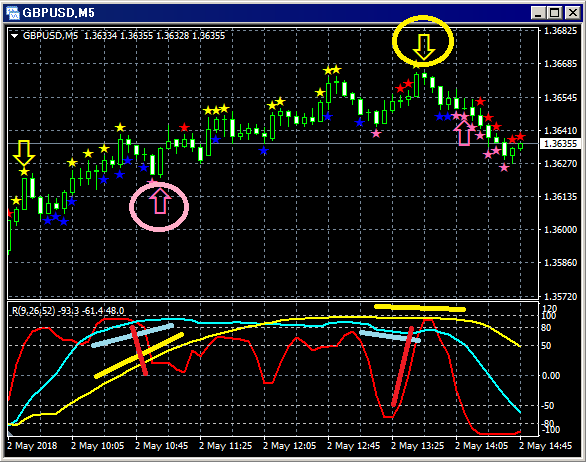
Upper section:BODSOR
Lower section: RCI three lines (red: RCI9, light blue: RCI26, yellow: RCI52)
(1) Buy on dip signal (pink arrows circled)
Among the three RCI lines, only RCI9 is clearly declining.
If RCI9 reverses and rises, all three RCIs may rise together, indicating a potential bullish moment.
In other words, price may rise strongly as well.
In such a situationBODSOR's buy on dip signal (pink arrow) lights up.
(2) Sell on rally signal (yellow arrows circled)
Among the three RCI lines, only RCI9 is clearly rising.
If RCI9 reverses and falls, all three RCIs may decline together, indicating a potential bearish moment.
In other words, price may fall strongly as well.
In such a situationBODSOR's sell on rally signal (yellow arrows) lights up.
Indicators displaying Buy on dip and Sell on rally signals 【BODSOR】
Twitter
https://twitter.com/RCIX3Line
Blog
http://bodsor.blog.fc2.com/
Investment Navigator+
https://fx-on.com/navi/serial/?id=359
YouTube
https://www.youtube.com/channel/UCL-g5uAlesiWVJEDtWlFvGw
Examples of Buy on dip and Sell on rally signals on USD/JPY 1-hour chart
※In the charts within this article, for convenience of explanation, please note that drawings such as circles, lines, and squares may be added.
Thank you for your understanding.


