

Example of a Reversal Sell Signal USDJPY 5-minute Chart 【RCI 3 lines + BODSOR】
The figure below is today's USD/JPY 5-minute chart.
USD/JPY 5-minute chart
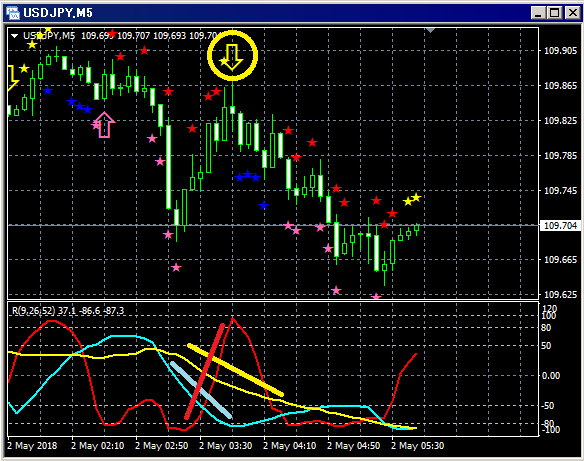
Top row:BODSOR
Bottom row: Three RCI lines (Red: RCI9, Light blue: RCI26, Yellow: RCI52)
Rebound selling signal (yellow arrows circled)
Among the three RCI lines, only RCI9 is clearly rising.
If RCI9 reverses and declines, all three RCIs may turn downward.
In other words, price may also fall sharply.
In such a situationBODSOR rebound selling signal (yellow arrows) lights up.
After the BODSOR signal lights up, a bearish candle appears and price continues to fall smoothly thereafter.In this case, it can be seen that the rebound selling signal functions well.Indicator that displays pullback buying and rebound selling signals [BODSOR]Twitterhttps://twitter.com/RCIX3LineBloghttp://bodsor.blog.fc2.com/Investment Navigator+https://fx-on.com/navi/serial/?id=359YouTubehttps://www.youtube.com/channel/UCL-g5uAlesiWVJEDtWlFvGwExample of pullback buying and rebound selling signals on the USD/JPY 1-hour chart*In the charts in this article, for convenience of explanation, please note that circles, lines, squares, etc., may be drawn.Thank you for your understanding.
In this case, it can be seen that the rebound selling signal functions well.
Indicator that displays pullback buying and rebound selling signals [BODSOR]
Twitter
https://twitter.com/RCIX3Line
Blog
http://bodsor.blog.fc2.com/
Investment Navigator+
https://fx-on.com/navi/serial/?id=359
YouTube
https://www.youtube.com/channel/UCL-g5uAlesiWVJEDtWlFvGw
Example of pullback buying and rebound selling signals on the USD/JPY 1-hour chart
*In the charts in this article, for convenience of explanation, please note that circles, lines, squares, etc., may be drawn.
Thank you for your understanding.


