

Example of a reversal sell signal EURJPY 4-hour chart [RCI three-line + BODSOR]
The figure below is the recent EUR/JPY 4-hour chart.
EUR/JPY 4-hour chart
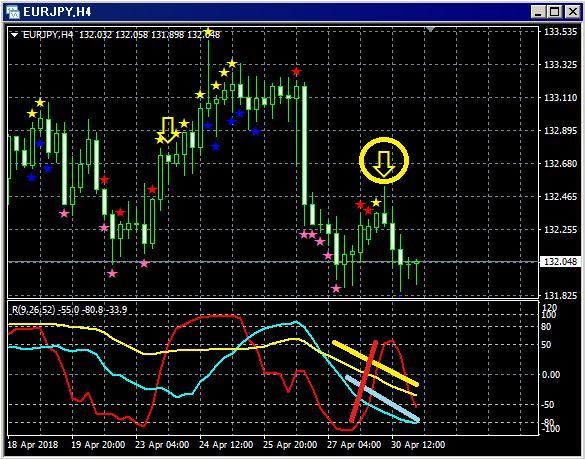
Upper part:BODSOR
Lower part: Three RCI lines (Red: RCI9, Light blue: RCI26, Yellow: RCI52)
Pullback sell signal (yellow arrows enclosed in circles)
Among the three RCI lines, only RCI9 is clearly rising.
If RCI9 reverses and declines, there is a possibility that all three RCIs will move downward.
In other words, there is a possibility that the price will drop hard as well.
In such a situationBODSORpullback sell signal (yellow arrows) lights up.
BODSORimmediately after the signal lights up, three bearish candles appear consecutively.
In this case, the pullback sell signal is functioning well.
Indicator displaying pullback buying and pullback sell signals【BODSOR】
Twitter
https://twitter.com/RCIX3Line
Blog
http://bodsor.blog.fc2.com/
Investment Navigator Plus
https://fx-on.com/navi/serial/?id=359
YouTube
https://www.youtube.com/channel/UCL-g5uAlesiWVJEDtWlFvGw
Example of pullback buying and pullback sell signals on USD/JPY 1-hour chart
*Please note that in the charts within this article, for convenience of explanation, circles, lines, and squares may be drawn in yen, straight lines, or squares.
Thank you for your understanding.


