

Examples of pullback buying signals on monthly chart level EURGBP【RCI 3-line + BODSOR】
The figure below shows the EUR/GBP monthly chart from January 2012 to April 2018.
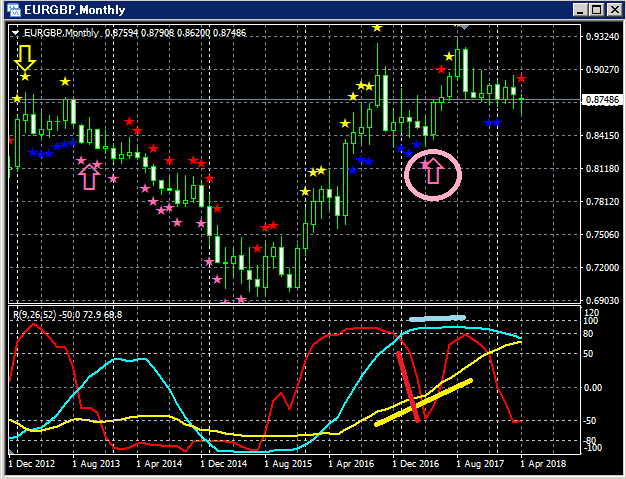
Top: BODSOR
Bottom: RCI three lines (red: RCI9, light blue: RCI26, yellow: RCI52)
Pullback Buy Signal (pink arrows circled)
Of the three RCI lines, only RCI9 is clearly declining.
If RCI9 reverses and rises, there is a possibility that all three RCIs rise together.
In other words, the price may rise strongly as well.
In such a situation,BODSOR pullback buy signal (pink arrows) lights up.
After the BODSOR signal lights up, four bullish candles appear in succession,
and in this case, it is clear that the pullback buy signal tends to work well.
Indicator that displays pullback buy and retracement sell signals [BODSOR]
Twitter
https://twitter.com/RCIX3Line
Blog
http://bodsor.blog.fc2.com/
Investment Navigator+
https://fx-on.com/navi/serial/?id=359
YouTube
https://www.youtube.com/channel/UCL-g5uAlesiWVJEDtWlFvGw
Example of pullback buy / retracement sell signals on USD/JPY 1-hour chart
*Note: In the charts within this article, for convenience of explanation, circles, lines, and squares may be drawn or added.
Please understand.


