

Common Trend Reversal Patterns: EUR/JPY 5-Minute Chart Example [RCI Three Lines + BOD SOR]
RCI3 Triple Top and Bottom: Buy on Dips and Sell on Rises after RCI3 Triple Top
The figure below is the EUR/JPY 5-minute chart as of April 24, 2018.
EURJPY 5-minute chart
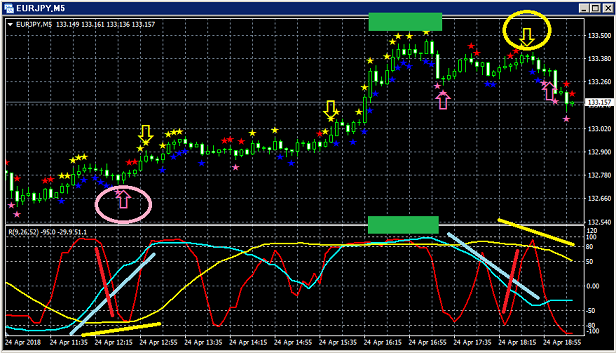
Upper: BODSOR
Lower: RCI3 lines (red: RCI9, light blue: RCI26, yellow: RCI52)
(1) Buy-on-dip signal (pink arrow enclosed in a circle)
Among the three RCI lines, only RCI9 is clearly declining.
If RCI9 reverses and starts to rise, all three RCI lines may rise together.
In other words, prices may rise strongly as well.
In such a situationBODSORbuy-on-dip signal (pink arrow) lights up.
BODSORImmediately after the signal lights up, a bullish candlestick appears, and prices continue to rise, so in this case the signal functions well as a buy-on-dip signal.
(2) Sell-on-rally signal (yellow arrow enclosed in a circle)
Among the three RCI lines, only RCI9 is clearly rising.
If RCI9 reverses and starts to fall, all three RCI lines may fall together.
In other words, prices may fall strongly as well.
In such a situationBODSORsell-on-rally signal (yellow arrow) lights up.
BODSORImmediately after the signal lights up, four consecutive bearish candles appear, and
prices continue to fall thereafter, so in this case the signal functions well as a sell-on-rally signal.
or rather as a sell-on-rally signal.
Indicator displaying Buy-on-Dip / Sell-on-Rally signals: BODSOR
Twitter
https://twitter.com/RCIX3Line
Blog
http://bodsor.blog.fc2.com/
Invest Navi+
https://fx-on.com/navi/serial/?id=359
YouTube
https://www.youtube.com/channel/UCL-g5uAlesiWVJEDtWlFvGw
Example of Buy-on-Dip and Sell-on-Rally signals on USD/JPY 1-hour chart
Note: In this article's charts, for convenience in explanation, currencies, straight lines, rectangles, etc. may be drawn, so please understand.
Please be aware of this.


