

Cryptocurrency rises from the dip-buying signal BTC/USD 1-hour chart【RCI three lines + BODSOR】
The figure below shows the BTC/USD 1-hour chart from April 18 to 25, 2018.
BTC/USD (Bitcoin / US Dollar) 1-hour chart
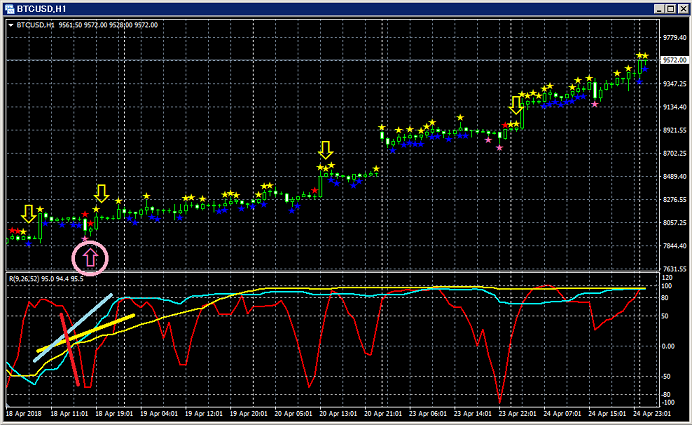
Upper panel:BODSOR
Lower panel: Three RCI lines (red: RCI9, light blue: RCI26, yellow: RCI52)
Buying on dips signal (pink arrows circled)
Among the three RCI lines, only RCI9 is clearly declining.
If RCI9 reverses and rises, all three RCIs may rise together.
In other words, price may rise strongly as well.
In such a situationBODSORbuying-on-dips signal (pink arrows) lights up.
Right after the signal lights up forBODSOR, two bullish candles occur in succession, and
prices continue to rise, so in this case the signal
functions well as a buying-on-dips signal.
Indicator displaying buying on dips and selling on rebounds: 【BODSOR】
Twitter
https://twitter.com/RCIX3Line
Blog
http://bodsor.blog.fc2.com/
Investment Navigator+
https://fx-on.com/navi/serial/?id=359
YouTube
https://www.youtube.com/channel/UCL-g5uAlesiWVJEDtWlFvGw
Examples of buy on dips and selling on rallies signals on USD/JPY 1-hour chart
※In the charts in this article, for convenience of explanation, you may see circles, straight lines, and squares drawn in to indicate certain points. Please note this.


