

Cryptocurrency rises from the dip-buy signal ETH/USD 1-hour chart [RCI 3 lines + BOD SOR]
The figure below is the ETH/USD 1-hour chart for April 2018.
(1) ETH/USD (Ethereum / U.S. dollar) 1-hour chart April 6–9, 2018
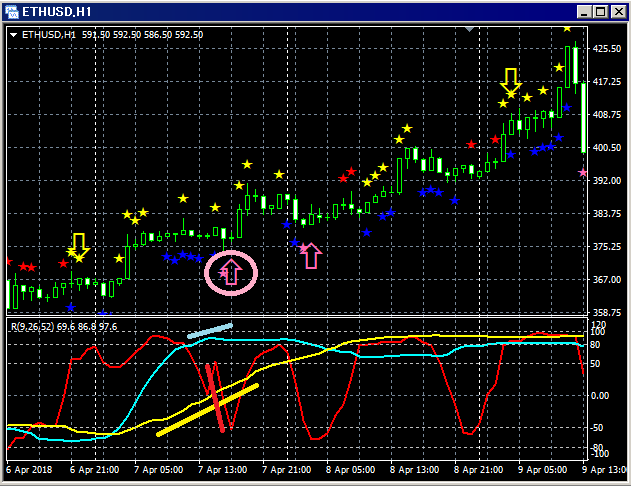
Upper section:BODSOR
Lower section: Three RCI lines (red: RCI9, light blue: RCI26, yellow: RCI52)
(2) ETH/USD (Ethereum / U.S. dollar) 1-hour chart April 17–20, 2018
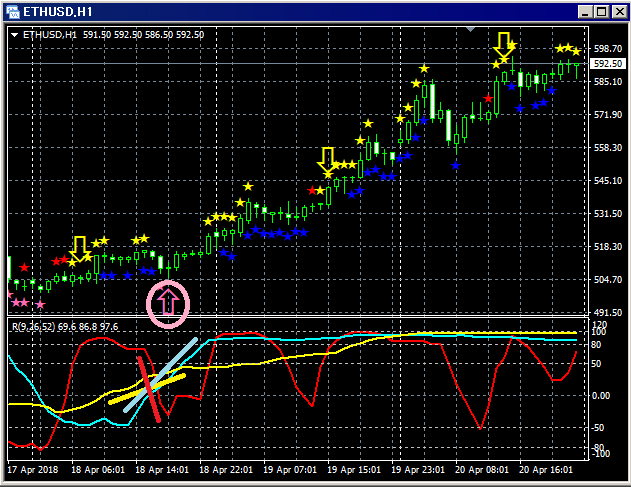
Upper section:BODSOR
Lower section: Three RCI lines (red: RCI9, light blue: RCI26, yellow: RCI52)
Pullback Buy Signal ( pink arrow circled )
Among the three RCI lines, only RCI9 is clearly declining.
If RCI9 reverses upward, there is a possibility that all three RCIs rise together.
In other words, the price could rise strongly as well.
In such a situation,BODSOR's pullback buy signal (pink arrow) lights up.
After the BODSOR signal lights up, the price has been rising smoothly, so
in this case it functions well as a pullback buy signal.
.
Indicator that displays pullback buy and retracement sell signals【BODSOR】
Twitter
https://twitter.com/RCIX3Line
Blog
http://bodsor.blog.fc2.com/
Investment Navigator+
https://fx-on.com/navi/serial/?id=359
YouTube
https://www.youtube.com/channel/UCL-g5uAlesiWVJEDtWlFvGw
Example of pullback buy and retracement sell signals on the USD/JPY 1-hour chart
Note: In the charts in this article, for convenience of explanation, you may see added circles, lines, and rectangles.
Please understand this.


