

Trade GBP/JPY on the 4-hour trend direction with an hourly chart 【Chart Study】
Enter in the direction of the 4-hour trend
The figure below is the GBP/JPY 4-hour chart up to April 20, 2018.
GBP/JPY 4-hour
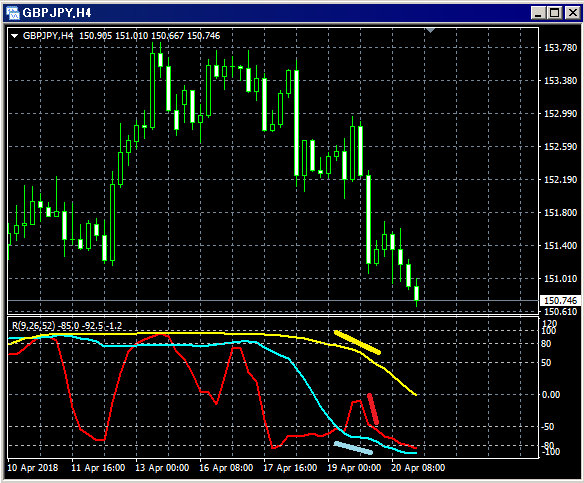
Lower row: Three RCI lines (red: RCI9, light blue: RCI26, yellow: RCI52)
On the most recent April 20, all three RCIs were declining, indicating a strong downtrend.
Now, let us look at the lower timeframe.
The figure below is the GBP/JPY 1-hour chart up to April 20, 2018.
GBP/JPY 1-hour
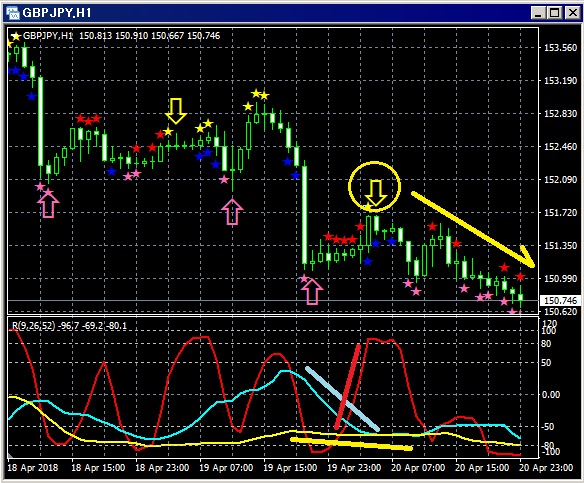
Upper row:BODSOR
Lower row: Three RCI lines (red: RCI9, light blue: RCI26, yellow: RCI52)
Sell-on-rebound signal (yellow arrows enclosed in a circle)
Among the three RCI lines, only RCI9 is clearly rising.
If RCI9 turns downward, all three RCIs may align to indicate a decline.
In other words, prices may fall strongly.
In this kind of situationBODSOR's sell-on-rebound signal (yellow arrows) lights up.
When the BODSOR signal lights upthe corresponding candle is an almost-shadowless (hammer-like) bearish candle.
Thereafter, prices fail to exceed the high of that candle and fall.
In this case, the sell-on-rebound signal tends to function well.
This demonstrates that, while the 4-hour chart shows a strong downtrend, the 1-hour chart’s sell-on-rebound signal
can work effectively.
Indicator displaying pullback buying and sell-on-rebound signals [BODSOR]
Twitter
https://twitter.com/RCIX3Line
Blog
http://bodsor.blog.fc2.com/
Investment Navi+
https://fx-on.com/navi/serial/?id=359
YouTube
https://www.youtube.com/channel/UCL-g5uAlesiWVJEDtWlFvGw
USD/JPY 1-hour: Examples of pullback buying and sell-on-rebound signals
※In this article’s charts, for convenience of explanation, circles, lines, and squares may have been added.
Please understand.


