

Cryptocurrency rises from a dip-buy signal XRP/USD 1-hour chart [RCI three-line + BODSOR]
The figure below shows the XRP/USD 1-hour chart from April 17 to 20, 2018.
XRP/USD (Ripple / US Dollar) 1-hour chart
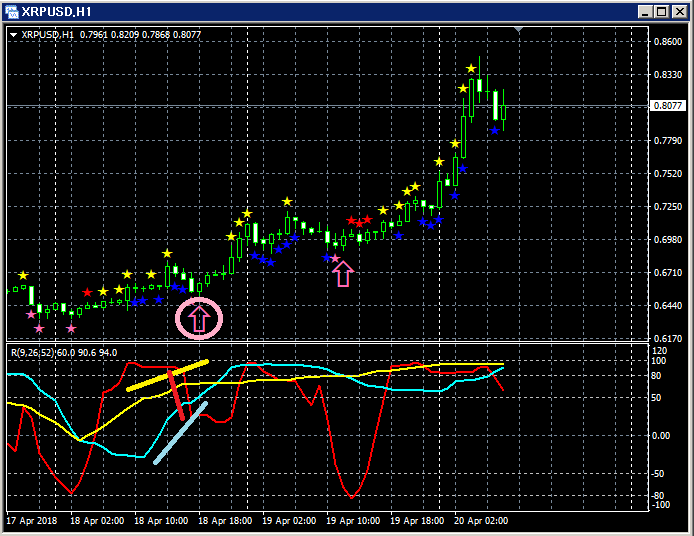
Upper section:BODSOR
Lower section: RCI three lines (red: RCI9, light blue: RCI26, yellow: RCI52)
Buy on dip signal (pink arrow circled)
Among the three RCI lines, only RCI9 is clearly declining.
If RCI9 turns up, it is possible that all three RCIs rise together.
In other words, the price may rise strongly as well.
In this kind of situationBODSORbuy-on-dip signal (pink arrow) lights up.
Immediately after the BODSOR signal lights up, bullish candles appear consecutively, and thereafterthe price continues to rise, so in this case the buy-on-dip signalis observed to function well.Indicator displaying buy-on-dip and sell-on-rally signals [BODSOR]Twitterhttps://twitter.com/RCIX3LineBloghttp://bodsor.blog.fc2.com/Investment Navigator Plushttps://fx-on.com/navi/serial/?id=359YouTubehttps://www.youtube.com/channel/UCL-g5uAlesiWVJEDtWlFvGwExample of Buy on Dip / Sell on Rally signals on USD/JPY 1-hour chartNote: In the charts within this article, for convenience, circles, lines, and rectangles may be drawn in yen or straight lines and squares, so please understand this.Please be aware of this.
the price continues to rise, so in this case the buy-on-dip signal
is observed to function well.
Indicator displaying buy-on-dip and sell-on-rally signals [BODSOR]
Twitter
https://twitter.com/RCIX3Line
Blog
http://bodsor.blog.fc2.com/
Investment Navigator Plus
https://fx-on.com/navi/serial/?id=359
YouTube
https://www.youtube.com/channel/UCL-g5uAlesiWVJEDtWlFvGw
Example of Buy on Dip / Sell on Rally signals on USD/JPY 1-hour chart
Note: In the charts within this article, for convenience, circles, lines, and rectangles may be drawn in yen or straight lines and squares, so please understand this.
Please be aware of this.


