

After courteously updating the low price, it spiked sharply: GBP/JPY 1-hour chart [RCI three lines + BODSOR]
The figure below is the 1-hour chart of GBP/JPY from April 17 to 19, 2018.
GBP/JPY 1-hour chart
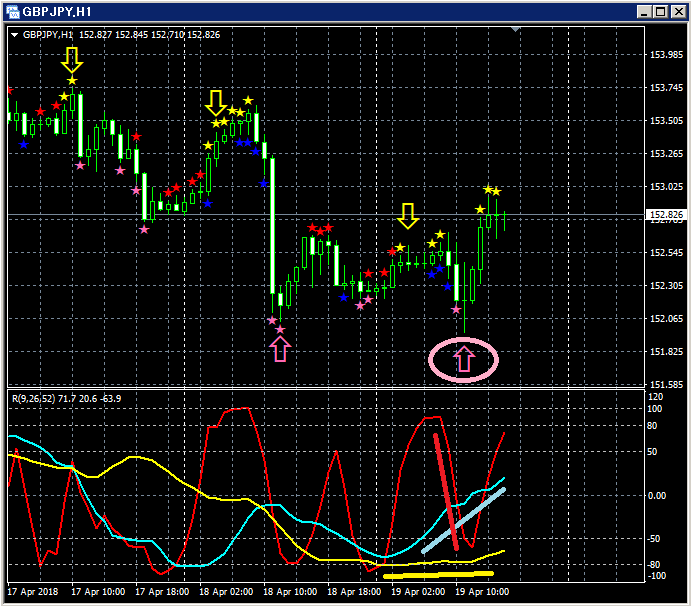
Upper panel:BODSOR
Lower panel: Three RCI lines (red: RCI9, light blue: RCI26, yellow: RCI52)
Pullback buy signal (pink arrows encircled)
Among the three RCI lines, only RCI9 is clearly trending downward.
If RCI9 turns upward, all three RCIs may rise together.
In other words, the price may rise strongly as well.
In such a situationBODSORpullback buy signal (pink arrow) lights up.
When the BODSOR signal lights upthere is a relatively large lower wick, and the recent low is broken
after which it surges. One could say it moves like a typical pound.
If we say so, up to that point it is the same as the other lines, but afterwards
three bullish candles occur consecutively and it surges.
Indicator displaying pullback buy and pullback sell signals【BODSOR】
Twitter
https://twitter.com/RCIX3Line
Blog
http://bodsor.blog.fc2.com/
Investment Navi+
https://fx-on.com/navi/serial/?id=359
YouTube
https://www.youtube.com/channel/UCL-g5uAlesiWVJEDtWlFvGw
USD/JPY 1-hour chart: examples of pullback buy and pullback sell signals
※In the charts within this article, for convenience, some annotations such as circles, straight lines, and rectangles may be drawn.
Please understand.


