

Sell signal lights up on the rebound after plummet: GBP/JPY 30-minute chart [RCI 3-line + BODSOR]
The figure below is a 30-minute chart of GBP/JPY around April 18, 2018.
GBP/JPY 30-minute chart
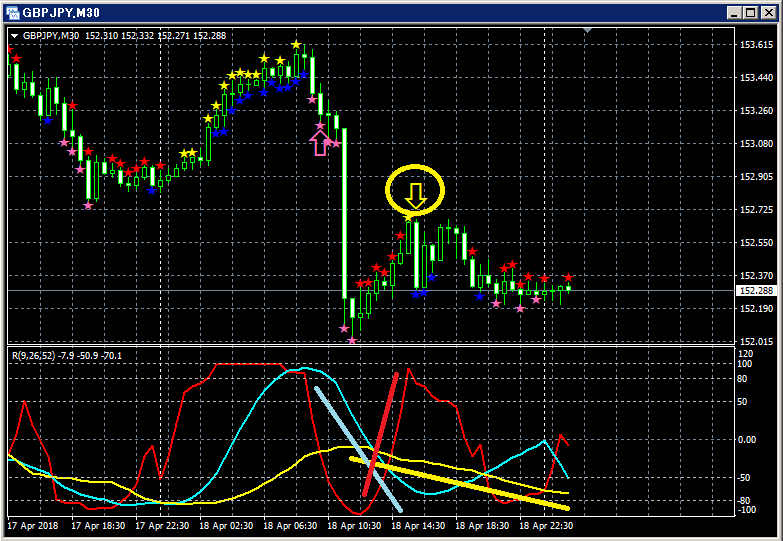
Upper row:BODSOR
Lower row: Three RCI lines (red: RCI9, light blue: RCI26, yellow: RCI52)
Sell-on-rally signal (yellow arrows circled)
Among the three RCI lines, only RCI9 is clearly rising.
If RCI9 reverses and declines, all three RCIs may decline together.
In other words, the price may undergo a strong decline.
In such a situationBODSORsell-on-rally signal (yellow arrows) lights up.
Immediately after the BODSOR signal lights up, a large bearish candlestick occurs.Indicator that displays pullback buying and sell-on-rally signals [BODSOR]Twitterhttps://twitter.com/RCIX3LineBloghttp://bodsor.blog.fc2.com/Investment Navigator Plushttps://fx-on.com/navi/serial/?id=359YouTubehttps://www.youtube.com/channel/UCL-g5uAlesiWVJEDtWlFvGwAn example of a pullback-buy and sell-on-rally signal on the 1-hour chart of USD/JPYNote: In the charts in this article, for convenience of explanations, there may be additions such as circles, lines, and rectangles.Please understand.
Indicator that displays pullback buying and sell-on-rally signals [BODSOR]
Twitter
https://twitter.com/RCIX3Line
Blog
http://bodsor.blog.fc2.com/
Investment Navigator Plus
https://fx-on.com/navi/serial/?id=359
YouTube
https://www.youtube.com/channel/UCL-g5uAlesiWVJEDtWlFvGw
An example of a pullback-buy and sell-on-rally signal on the 1-hour chart of USD/JPY
Note: In the charts in this article, for convenience of explanations, there may be additions such as circles, lines, and rectangles.
Please understand.


