

Trigger on the daily trend direction GBP/JPY 4-hour chart [Chart Study]
Enter on the daily trend direction
The figure below is the GBP/JPY daily chart up to around April 11, 2018.
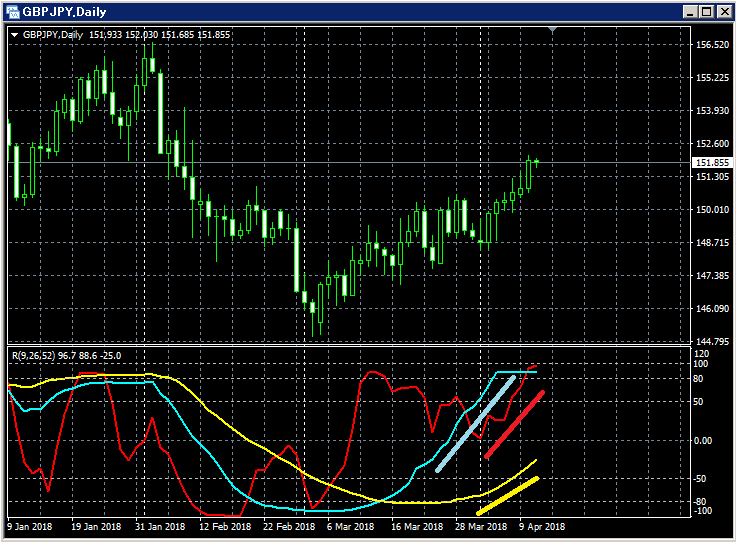
Lower section: RCI three-line indicator (red: RCI9, light blue: RCI26, yellow: RCI52)
In the last few days, all three RCI lines have been rising, indicating a strong bullish momentum.
Now, let us look at the lower time frame.
The figure below is the GBP/JPY 4-hour chart up to around April 11, 2018.
GBP/JPY 4-hour chart
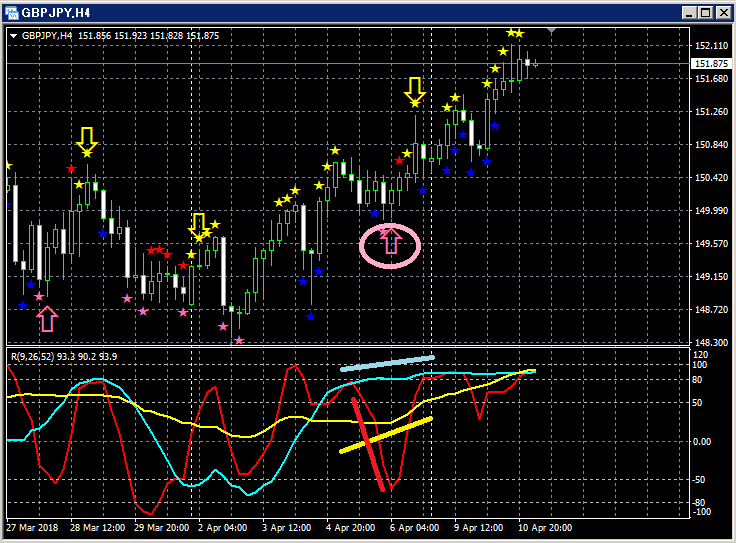
Upper section:BODSOR
Lower section: RCI three-line indicator (red: RCI9, light blue: RCI26, yellow: RCI52)
Buy the dip signal (pink arrows encircled)
Among the three RCI lines, only RCI9 is clearly declining.
If RCI9 reverses upward, all three RCI lines may rise together.
In other words, the price may also rise strongly.
In this type of situation,BODSORbuy-the-dip signal (pink arrows) lights up.
Right after the BODSOR signal lights up, four consecutive bullish candles form,
and it continues to rise smoothly, making it a well-functioning buy-the-dip signal in this case.
The above is an example where the daily chart shows a strong uptrend while the 4-hour chart buy-the-dip signal functioned well.
well-functioning as a buy-the-dip signal in this context.
Indicator that displays Buy-the-dip / Sell-retrace signals [BODSOR]
Twitter
https://twitter.com/RCIX3Line
Blog
http://bodsor.blog.fc2.com/
Investment Navigator+
https://fx-on.com/navi/serial/?id=359
YouTube
https://www.youtube.com/channel/UCL-g5uAlesiWVJEDtWlFvGw
USD/JPY 1-hour chart example of Buy-the-dip / Sell-retrace signals
※Please note that in the charts within this article, for convenience of explanation, currency symbols, straight lines, and boxes may have been added.
Thank you for your understanding.


