

Capture Trend Reversal: USD/JPY 1-Hour Chart [RCI Three Lines + BODSOR]
RCI3 Double Top and Bottom: Buy on Dip Before Double Top and Sell on Rip After Double Top
The figure below shows the USD/JPY 1-hour chart from April 11 to April 17, 2018.
USD/JPY 1-Hour Chart
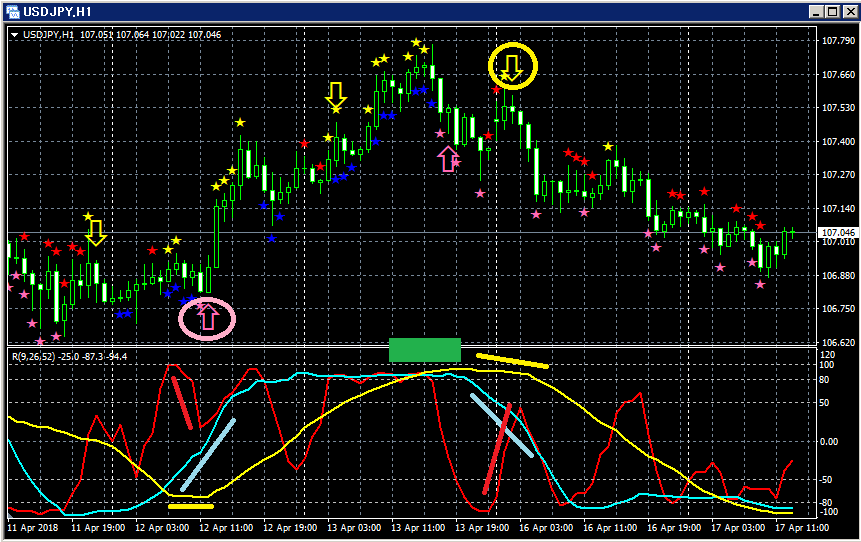
Upper section:BODSOR
Lower section: RCI 3 lines (red: RCI9, light blue: RCI26, yellow: RCI52)
(1) Buy on Dip Signal (pink arrows circled)
Among the three RCI lines, only RCI9 is clearly moving downward.
If RCI9 reverses and rises, there is a possibility that all three RCIs will rise together.
That is, the price may also rise strongly.
In such a situationBODSORBuy-on-dip signal (pink arrows) lights up.
BODSORImmediately after the signal lights, five bullish candles occur in a row, and
the price continues to rise, so in this case the dip-buy signal is working well as a
buy-on-dip signal.
(2) Sell on Rally Signal (yellow arrows circled)
Among the three RCI lines, only RCI9 is clearly rising.
If RCI9 reverses and falls, there is a possibility that all three RCIs will fall together.
That is, the price may fall strongly as well.
In such a situationBODSORSell-on-rally signal (yellow arrows) lights up.
BODSORImmediately after the signal lights, four bearish candles occur in a row, and
the price continues to fall, so in this case the sell-on-rally signal is working well.
as a signal.
Indicator that displays Buy-on-Dip and Sell-on-Rally signals【BODSOR】
Twitter
https://twitter.com/RCIX3Line
Blog
http://bodsor.blog.fc2.com/
Investment Navi+
https://fx-on.com/navi/serial/?id=359
YouTube
https://www.youtube.com/channel/UCL-g5uAlesiWVJEDtWlFvGw
USD/JPY 1-Hour
※ In the charts in this article, for convenience of explanation, there may be additions such as yen marks, straight lines, or squares,
so please understand.


