

Enter on the daily trend direction NZD/JPY 1-hour chart [RCI 3 lines + BODSOR]
Trade in the daily trend direction
The figure below is the NZD/JPY daily chart up to around April 9, 2018.
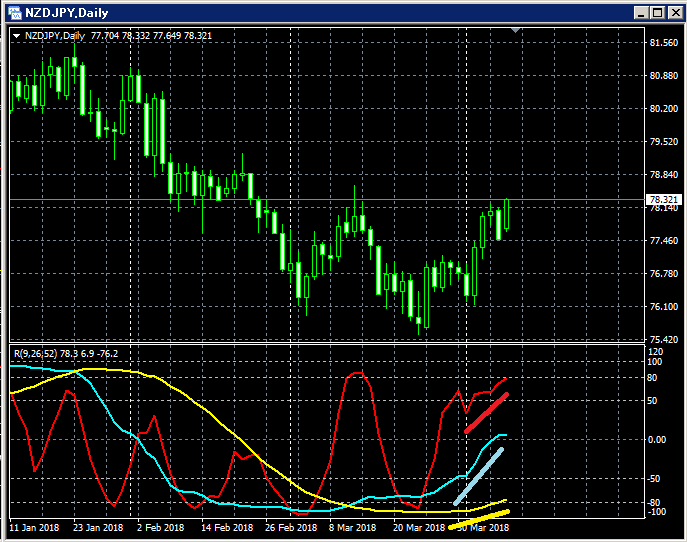
Lower section: Three lines of RCI (red: RCI9, light blue: RCI26, yellow: RCI52)
In the last few days, all three RCI lines have been rising, indicating a strong upward trend.
Now, let us look at a lower time frame.
The figure below is the NZD/JPY 1-hour chart for last week (April 5–April 9, 2018).
NZD/JPY 1-hour chart
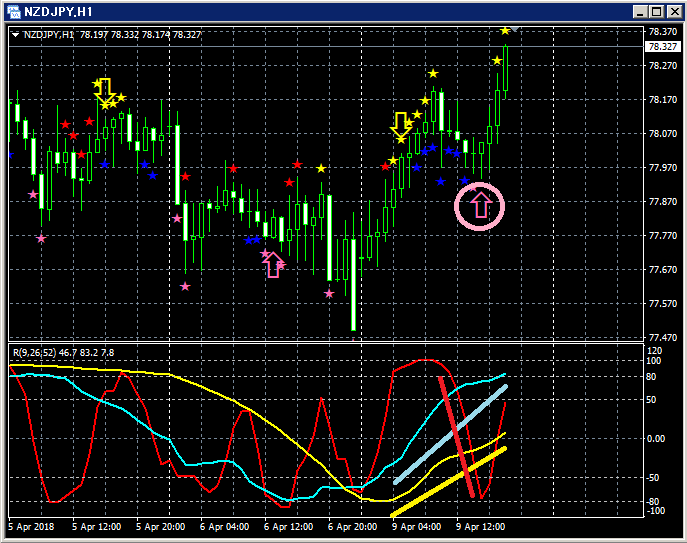
Upper part:BODSOR
Lower part: Three lines of RCI (red: RCI9, light blue: RCI26, yellow: RCI52)
Buy the dips signal (pink arrows encircled)
Among the three RCI lines, only RCI9 is clearly declining.
If RCI9 reverses and starts rising, all three RCIs may rise together.
In other words, prices may rise strongly.
In this kind of situation,BODSORbuy-the-dip signal (pink arrows) lights up.
Right after the BODSOR signal lights up, four consecutive bullish candles appear,and in this case the dip-buy signal is shown to function well.The above is an example where the daily chart shows a strong rise while the 1-hour chart’s buy-the-dip signal functions well.Indicator to display Buy-the-Dip / Sell-the-Rally signals 【BODSOR】Twitterhttps://twitter.com/RCIX3LineBloghttp://bodsor.blog.fc2.com/Investment Navi+https://fx-on.com/navi/serial/?id=359YouTubehttps://www.youtube.com/channel/UCL-g5uAlesiWVJEDtWlFvGwUSD/JPY 1-hour chart
and in this case the dip-buy signal is shown to function well.
The above is an example where the daily chart shows a strong rise while the 1-hour chart’s buy-the-dip signal functions well.
Indicator to display Buy-the-Dip / Sell-the-Rally signals 【BODSOR】
Twitter
https://twitter.com/RCIX3Line
Blog
http://bodsor.blog.fc2.com/
Investment Navi+
https://fx-on.com/navi/serial/?id=359
YouTube
https://www.youtube.com/channel/UCL-g5uAlesiWVJEDtWlFvGw
USD/JPY 1-hour chart


