

Yesterday rose rapidly from just after the sign lit up - USD/JPY 1-hour chart [RCI 3-line + BODSOR]
The figure below is the USD/JPY 1-hour chart from April 10 to 13, 2018.
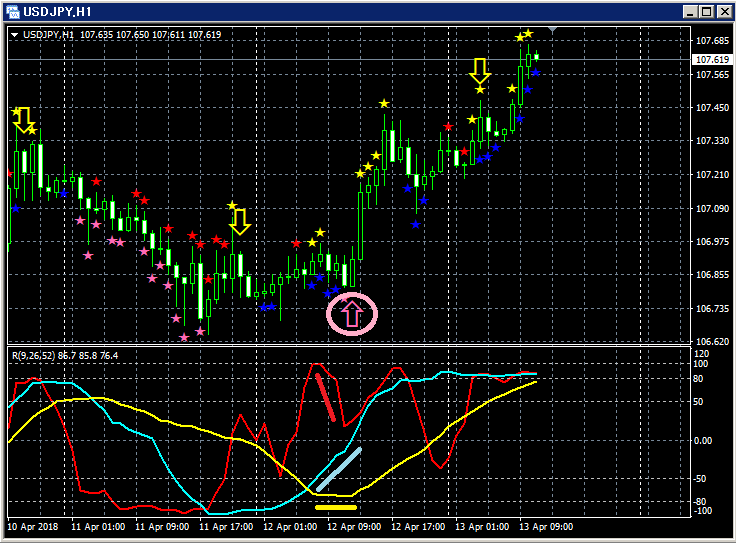
Upper part:BODSOR
Lower part: Three-line RCI indicators (red: RCI9, light blue: RCI26, yellow: RCI52)
Pullback Buy Signal (pink arrows circled)
Among the three RCI lines, only RCI9 is clearly declining.
If RCI9 reverses and rises, all three RCIs may rise together.
In other words, it suggests that the price may rise strongly as well.
In such a situationBODSORpullback buy signal (pink arrows) lights up.
Right after the BODSOR signal lights up, five consecutive bullish candles occur,and in this case it is shown to function well as a pullback buy signal.Indicator that displays pullback buy and pullback sell signals【BODSOR】Twitterhttps://twitter.com/RCIX3LineBloghttp://bodsor.blog.fc2.com/Investment Navi+https://fx-on.com/navi/serial/?id=359YouTubehttps://www.youtube.com/channel/UCL-g5uAlesiWVJEDtWlFvGwUSD/JPY 1-hourCAD/JPY 1-hour
and in this case it is shown to function well as a pullback buy signal.
Indicator that displays pullback buy and pullback sell signals【BODSOR】
Twitter
https://twitter.com/RCIX3Line
Blog
http://bodsor.blog.fc2.com/
Investment Navi+
https://fx-on.com/navi/serial/?id=359
YouTube
https://www.youtube.com/channel/UCL-g5uAlesiWVJEDtWlFvGw
USD/JPY 1-hour
CAD/JPY 1-hour


