

Example of a fading (selling) signal NZD/JPY 1-hour chart [RCI three lines + BODSOR]
RCI Three-LineandBODSORuse cases
One of the features of the three-line RCI (RCI9, RCI26, RCI52)
「When all three RCIs line up in the same direction, the price movement in that direction tends to be larger」
is the idea.
If RCI26 and RCI52 are rising (falling) and RCI9 is falling (rising),
when RCI9 reverses「all three RCIs line up in the same direction」will occur.
Therefore, detecting when RCI9 will reverse is extremely important.
(Case by case, but simply waiting for RCI9 to confirm a reversal often causes a significant delay.)
To detect as early as possible the timing when the momentum of RCI9 to rise (fall) weakens, BODSOR was developed.
The figure below is the 1-hour chart of NZD/JPY from March 26 to 29.
NZD/JPY 1-Hour Chart
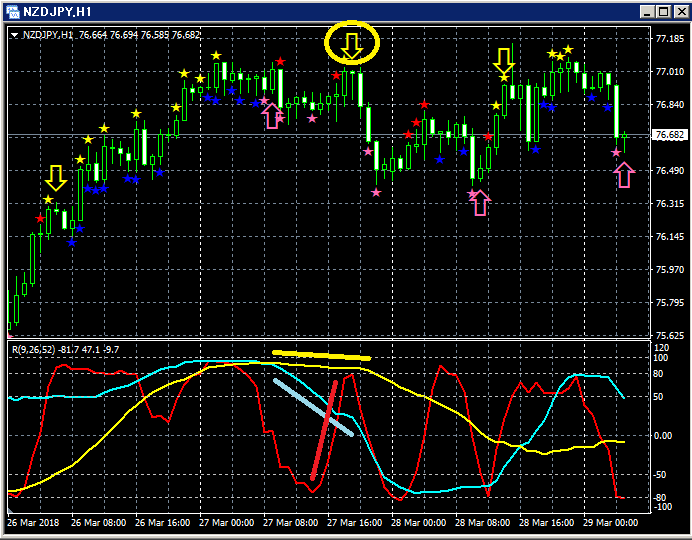
Top: BODSOR
Bottom: RCI Three-Line (red: RCI9, light blue: RCI26, yellow: RCI52)
Looking at the upper chart, on March 27 the signal of “RCI Three-Line + BODSOR”
recovery/sell signal (yellow arrow) lights up.
Among the three RCIs, only RCI9 is rising.
If RCI9 reverses downward, all three RCIs may align to the downside.
In other words, price could fall strongly.
In this kind of situation,the signal of BODSORlights up.
Immediately after the BODSOR signal lights up, four consecutive bearish candles appear. In this case,it functions well as a reversal/sell signal.Indicator to display Buy the Dip / Sell the Rally【BODSOR】Twitterhttps://twitter.com/RCIX3LineBloghttp://bodsor.blog.fc2.com/Invest Navi+https://fx-on.com/navi/serial/?id=359YouTubehttps://www.youtube.com/channel/UCL-g5uAlesiWVJEDtWlFvGwUSD/JPY 1-HourCAD/JPY 1-Hour
it functions well as a reversal/sell signal.
Indicator to display Buy the Dip / Sell the Rally【BODSOR】
Twitter
https://twitter.com/RCIX3Line
Blog
http://bodsor.blog.fc2.com/
Invest Navi+
https://fx-on.com/navi/serial/?id=359
YouTube
https://www.youtube.com/channel/UCL-g5uAlesiWVJEDtWlFvGw
USD/JPY 1-Hour
CAD/JPY 1-Hour


