

Example of a reversal selling signal — NZD/USD 1-hour chart [RCI three lines + BODSOR]
RCI Three-LineandBODSORUsage Examples
One of the features of the RCI three-line (RCI9, RCI26, RCI52) is
“When the three RCIs line up in the same direction, the price movement in that direction becomes larger.”
This is what it means.
If RCI26 and RCI52 are rising (falling) and RCI9 is falling (rising),
when RCI9 reverses“all three RCIs line up in the same direction”is the case.
Therefore, detecting when RCI9 will reverse is very important.
(Case by case, but simply waiting for RCI9 reversal to be confirmed often leads to a large lag.)
Thus, to quickly detect the timing when the upward (downward) momentum of RCI9 weakens
, BODSOR was developed.
The figure below is the 1-hour chart of NZD/USD from March 26 to 29.
NZD/USD 1-Hour Chart
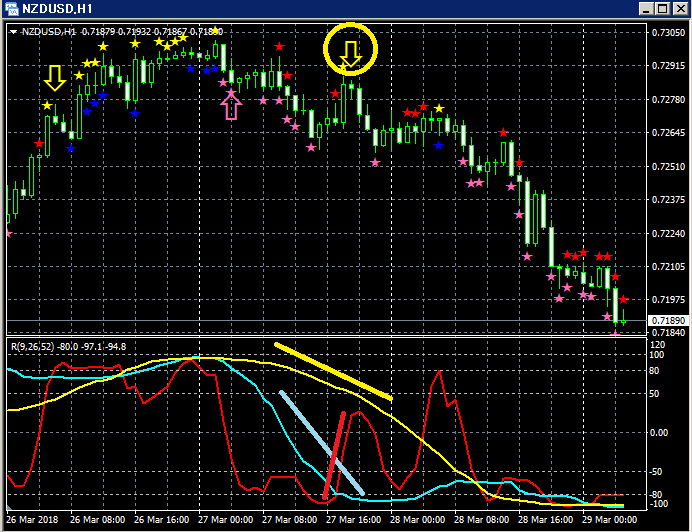
Top panel:BODSOR
Bottom panel: RCI Three-Line (red: RCI9, light blue: RCI26, yellow: RCI52)
From the above chart, on March 27 you can see the “RCI Three-Line + BODSOR”
rebound selling signal (yellow arrow) is lit.
Among the three RCIs, only RCI9 is rising.
If RCI9 reverses downward, all three RCIs may align to downward.
In other words, price may also fall strongly.
In such a situation,BODSOR signals lights (yellow arrow).
Right after the signal of BODSOR turns on, four bearish candles occur in a row. In this casethe rebound-selling signal functions well.Indicator displaying Overbought/Spike? Rebound Sell Signals: 【BODSOR】Twitterhttps://twitter.com/RCIX3LineBloghttp://bodsor.blog.fc2.com/Investment Navi+https://fx-on.com/navi/serial/?id=359YouTubehttps://www.youtube.com/channel/UCL-g5uAlesiWVJEDtWlFvGwUSD/JPY 1-HourCAD/JPY 1-Hour
the rebound-selling signal functions well.
Indicator displaying Overbought/Spike? Rebound Sell Signals: 【BODSOR】
Twitter
https://twitter.com/RCIX3Line
Blog
http://bodsor.blog.fc2.com/
Investment Navi+
https://fx-on.com/navi/serial/?id=359
YouTube
https://www.youtube.com/channel/UCL-g5uAlesiWVJEDtWlFvGw
USD/JPY 1-Hour
CAD/JPY 1-Hour


