

High-precision buy-the-dip and sell-the-rally signals USD/JPY 1-hour and 15-minute charts【RCI 3 lines + BODSOR】
0
From the March 27, 2018 chart
Buy the dip signal
USD/JPY 1-hour chart
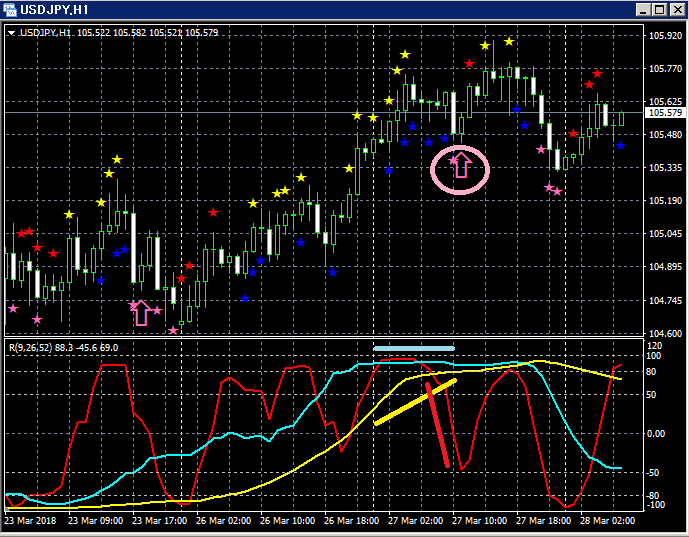
In a situation where among the three RCI lines only the RCI9 is clearly declining, the BODSOR signal (pink arrow) lights up.
A strong bullish candle appears two in a row immediately after the signal lights up.
Sell on a rally signal
USD/JPY 15-minute chart
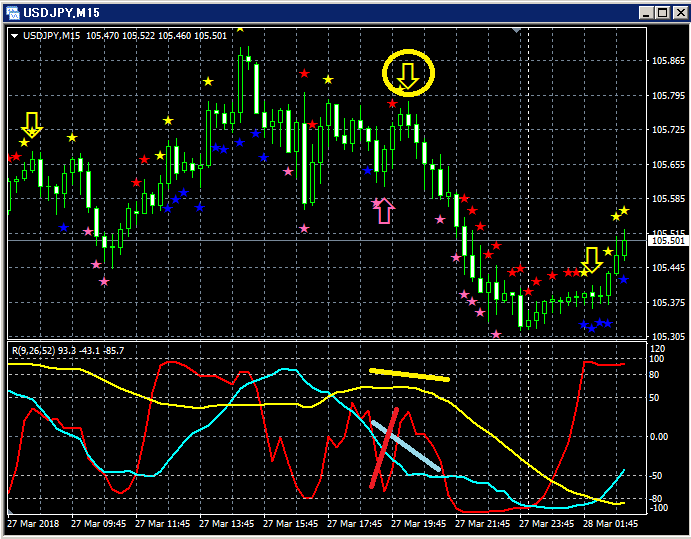
In a situation where among the three RCI lines only the RCI9 is clearly rising, the BODSOR signal (yellow arrow) lights up.
Five consecutive bearish candles occur immediately after the signal lights up.
Indicator that displays Buy the dip / Sell on rally signals【BODSOR】
× ![]()


