

RCI3本ラインとの組み合わせで威力を発揮するインジケーター「BODSOR」
【BODSOR】
An indicator developed to improve entry accuracy when applying pullback buying or pullback selling using the RCI three-line.
※ Please note that the indicator itself (BODSOR) does not include an indicator to display the RCI three lines.
“RCI Three Lines + BODSOR” for pullback buying and pullback selling
One of the features of the RCI three lines (RCI9, RCI26, RCI52) is
“When all three RCIs point in the same direction, the price movement in that direction tends to be larger.”
This is one of the characteristics.
If RCI26 and RCI52 are rising (falling) while RCI9 is falling (rising),
when RCI9 reverses,“All three RCIs point in the same direction.”This implies.
Therefore, detecting when RCI9 will reverse is extremely important.
(Case by case, if you simply wait for a definitive reversal of RCI9, you often lag behind significantly.)
Thus, BODSOR was developed to detect as early as possible when the momentum of rising (or falling) RCI9 weakens.
This is the purpose of BODSOR.
The figure below shows the USD/CAD 1-hour chart from March 16–22.
USD/CAD 1-hour chart
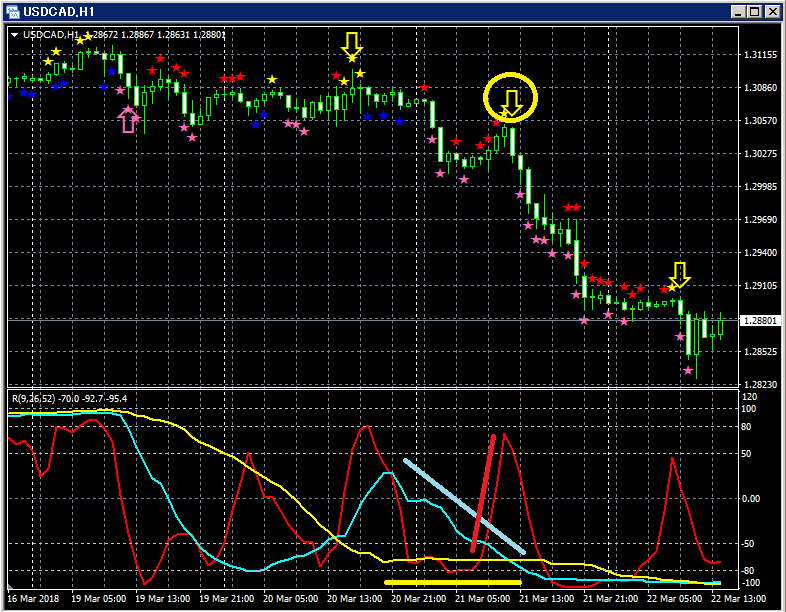
Upper pane:BODSOR
Lower pane: RCI three lines (red: RCI9, light blue: RCI26, yellow: RCI52)
Looking at the upper chart, on March 21 the “RCI Three Lines + BODSOR”
reversal selling signal (yellow arrow) lights up.
Among the three RCIs, only RCI9 is clearly rising.
If RCI9 reverses downward, all three RCIs may align in a downward direction.
In other words, price may undergo a strong decline.
In such a situation,BODSORsignals (yellow arrow) light up.
After BODSOR
the price continues to fall smoothly, so in this case the signal works well as a pullback selling signal.
Among the three RCI lines,the long-term linewhich isRCI52is given the most importance,
the mid-term linewhich isRCI26being ignored can still yield valid pullback selling signals as shown below.
The figure below shows the USD/JPY 1-hour chart from March 20–26.
USD/JPY 1-hour

Upper pane:BODSOR
Lower pane: RCI three lines (red: RCI9, light blue: RCI26, yellow: RCI52)
RCI9 is rising and RCI52 is falling among the three RCIs.
If RCI9 reverses downward, there is a possibility that RCI9 and RCI52 will align downward.
In such a situation,BODSORsignal (yellow arrow) lights up.
After BODSORsignal lights up, three consecutive bearish candles occur immediately after. Since then, the price continues to fall smoothly, so in this case it functions well as a pullback selling signal.
Please check, in the video (USD/JPY 1-hour), at what timing the pullback buying and pullback selling signals of “RCI Three Lines + BODSOR” appear.
Indicator that displays pullback buying and pullback selling signals【BODSOR】


