

Example of a Rebound Selling Signal in BTC/USD (Bitcoin / U.S. Dollar) [RCI Three Lines + BODSOR]
Three-line RCIandBODSORusage example
One feature of the three-line RCI (RCI9, RCI26, RCI52) is
“When the three RCIs align in the same direction, the price movement in that direction tends to be larger.”
There is such a phenomenon.
When RCI26 and RCI52 are rising (falling) and RCI9 is falling (rising),
if RCI9 reverses“three RCIs align and point in the same direction”is the case.
Therefore, detecting when RCI9 will reverse is very important.
(Case by case, but simply waiting for a definitive reversal of RCI9 often leads to significant late entries.)
Thus, to quickly detect the moment when the momentum of the rise (fall) of RCI9 weakens
, BODSOR was developed.
First, below is the BTC/USD (Bitcoin/US Dollar) daily chart from May to July 2017.
BTC/USD (Bitcoin/US Dollar) Daily
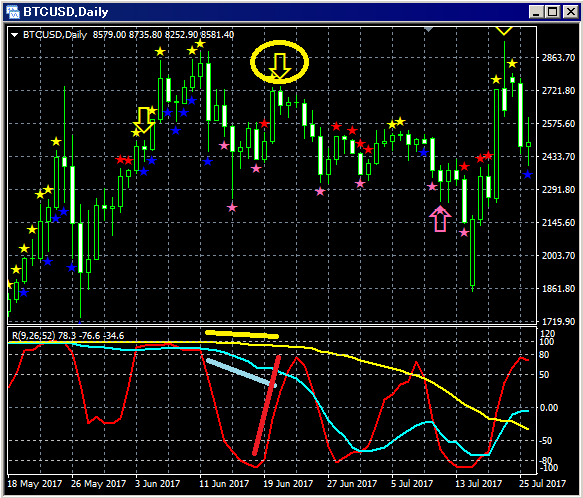
Top: BODSOR
Bottom: RCI3 lines (red: RCI9, light blue: RCI26, yellow: RCI52)
Among the three RCI lines, only RCI9 is clearly rising.
If RCI9 reverses downward, all three RCIs may align to move downward.
In other words, price could experience a strong decline.
In such a situation,the BODSORrebound-sell signal (yellow arrow) lights up.
Immediately after BODSORsignal lights up, a real-bodied bearish candle appears, and thereafter
price continues to decline smoothly, so in this case the rebound-sell signal
functions well.
Indicator displaying Dip-buy/Resell-signal: BODSOR
Twitter
https://twitter.com/RCIX3Line
Blog
http://bodsor.blog.fc2.com/
Investment Navigator+
https://fx-on.com/navi/serial/?id=359
YouTube
https://www.youtube.com/channel/UCL-g5uAlesiWVJEDtWlFvGw


