

Example of a selling signal - EUR/USD 15-minute chart [RCI 3 lines + BODSOR]
RCI Three-LineandBODSORApplications
One of the features of the RCI three-line (RCI9, RCI26, RCI52) is
“When the three RCIs are aligned in the same direction, the price movement in that direction tends to be larger.”
There is such a tendency.
When RCI26 and RCI52 are rising (falling) and RCI9 is falling (rising),
if RCI9 reverses“the three RCIs align in the same direction”will occur.
Therefore, it is very important to detect when RCI9 will reverse.
(Case by case, but simply waiting for RCI9 reversal to be confirmed often causes a significant delay.)
Thus, to detect as early as possible the timing when the rising (falling) momentum of RCI9 weakens
, BODSOR was developed.
The figure below is the EUR/USD 15-minute chart on March 22.
EUR/USD 15-minute
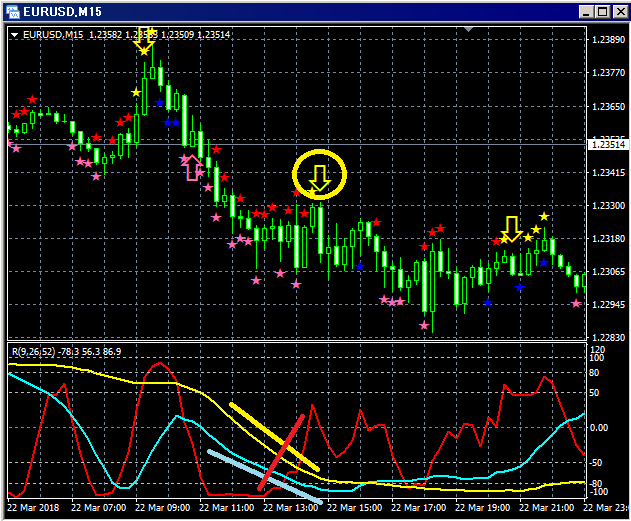
Top: BODSOR
Bottom: RCI Three-Line (Red: RCI9, Light blue: RCI26, Yellow: RCI52)
Among the three RCI lines, only RCI9 is clearly rising.
If RCI9 reverses downward, all three RCIs may move downward together.
In other words, the price may experience a strong fall.
In such a situation,BODSOR’s pullback sell signal (yellow arrow) lights up.
BODSOR’s signal lights up, and a large bearish candlestick occurs immediately after, and the price continues to fall, so in this case it functions well as a pullback sell signal.
Indicator that shows Buy-the-dip/ Sell-the-rally signals【BODSOR】
Twitter
https://twitter.com/RCIX3Line
Blog
http://bodsor.blog.fc2.com/
Investment Navigator+
https://fx-on.com/navi/serial/?id=359


