

Example of a bearish reversal signal USD/CHF Daily Chart [RCI 3 lines + BODSOR]
RCI 3-lineandBODSORUsage examples
One of the characteristics of the RCI 3-line (RCI9, RCI26, RCI52) is
“When the three RCI lines align in the same direction, the price movement in that direction becomes larger.”
This is what happens.
When RCI26 and RCI52 are rising (or falling) and RCI9 is falling (or rising),
if RCI9 reverses,“The three RCI lines align in the same direction.”This is what it means.
Therefore, detecting when RCI9 will reverse is very important.
(Case by case, but simply waiting for the reversal of RCI9 to be confirmed often causes significant delay.)
Thus, to detect as early as possible the moment when the upward (downward) momentum of RCI9 weakens,
BODSOR was developed.
The figure below shows the USD/CHF daily chart from the end of last year to this year.
USD/CHF Daily
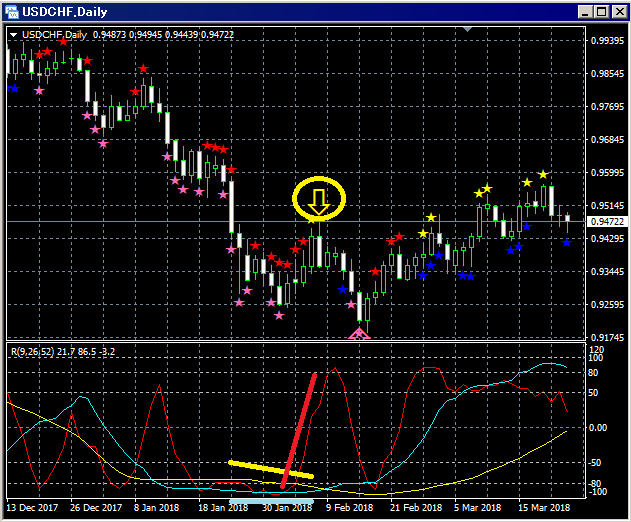
Top: BODSOR
Bottom: RCI 3-line (Red: RCI9, Light blue: RCI26, Yellow: RCI52)
Among the three RCI lines, only RCI9 is clearly rising.
If RCI9 reverses downward, all three RCI lines could move downward together.
In other words, price could also drop strongly.
In such a situation,BODSOR's pullback selling signal (yellow arrow) lights up.
After the BODSOR signal lights up, the price has been falling steadily, so
in this case, it can be seen to function well as a pullback selling signal.
Indicator that displays pullback buying and pullback selling signals [BODSOR]
Twitter
https://twitter.com/RCIX3Line
Blog
http://bodsor.blog.fc2.com/
Investment Navigator+
https://fx-on.com/navi/serial/?id=359


