

Examples of Sell Signals USD/CAD 1-Hour Chart【RCI three lines + BODSOR】
RCI 3-LineandBODSORApplications
One of the features of the three-line RCI (RCI9, RCI26, RCI52) is
“If the three RCIs line up in the same direction, the price movement in that direction tends to be larger.”
This is one of the ideas.
When RCI26 and RCI52 are rising (falling) and RCI9 is falling (rising),
if the RCI9 reverses“the three RCIs line up in the same direction”will be the case.
Therefore, detecting when RCI9 will reverse is very important.
(Case by case, if you simply wait for a confirmed reversal of RCI9, you will often be late.)
To detect as early as possible the moment when the upward (downward) momentum of RCI9 weakens, BODSOR was developed.
The figure below is an hourly chart of USD/CAD from March 19 to 22.
USD/CAD 1-hour chart
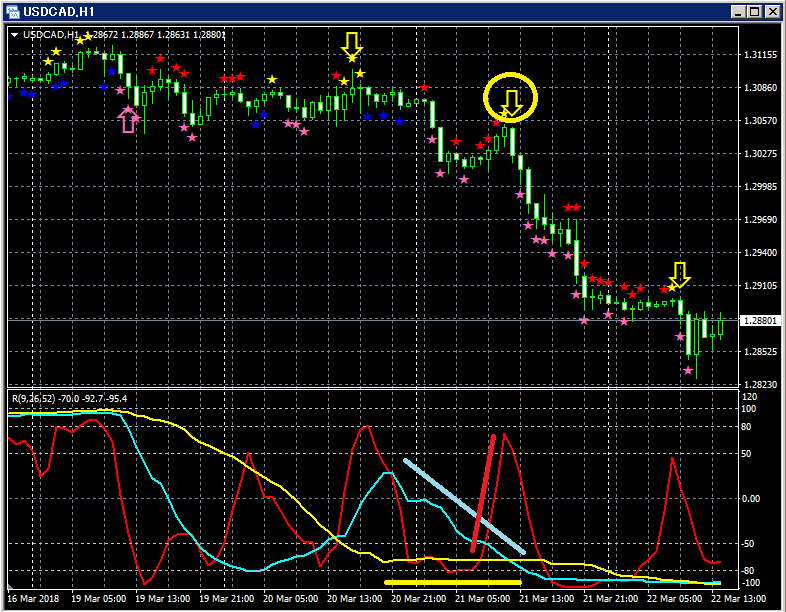
Top: BODSOR
Bottom: RCI 3 lines (red: RCI9, light blue: RCI26, yellow: RCI52)
Looking at the chart above, on March 21, the “RCI 3-Line + BODSOR”
reversal-sell signal (yellow arrow) is illuminated.
Among the three RCI lines, only RCI9 is clearly rising.
If RCI9 reverses downward, all three RCIs may align downward.
In other words, price may experience a strong decline.
In such a situation,BODSORreversal-sell signal (yellow arrow) lights up.
Immediately after the BODSOR signal lights up, six bearish candles occur in a row. Since prices continue to fall afterward, in this case the reversal-sell signalfunctions well.Indicator that displays pullback-buy and pullback-sell signals【BODSOR】Twitterhttps://twitter.com/RCIX3LineBloghttp://bodsor.blog.fc2.com/Investment Navigator Plushttps://fx-on.com/navi/serial/?id=359
functions well.
Indicator that displays pullback-buy and pullback-sell signals【BODSOR】
Twitter
https://twitter.com/RCIX3Line
Blog
http://bodsor.blog.fc2.com/
Investment Navigator Plus
https://fx-on.com/navi/serial/?id=359


