

Selling on a pullback using a combination of daily and 1-hour charts (Nikkei 225 futures)
RCI 3-LineandBODSORUsage Examples
One of the features of the three-line RCI (RCI9, RCI26, RCI52) is
“If the three RCIs line up in the same direction, the price movement in that direction tends to be larger.”
This is what it means.
When RCI26 and RCI52 are rising (or falling) and RCI9 is falling (or rising),
if RCI9 reverses,“All three RCIs line up in the same direction”is the case.
Therefore, it becomes very important to anticipate when RCI9 will reverse.
(Case by case, but simply waiting for a confirmed reversal of RCI9 often results in a significant delay.)
Hence, in order to detect as early as possible the moment when the momentum of RCI9’s rise (or fall) weakens, BODSOR was developed.
The figure below shows the daily chart of the Nikkei 225 futures since the end of last year.
Nikkei 225 Futures Daily
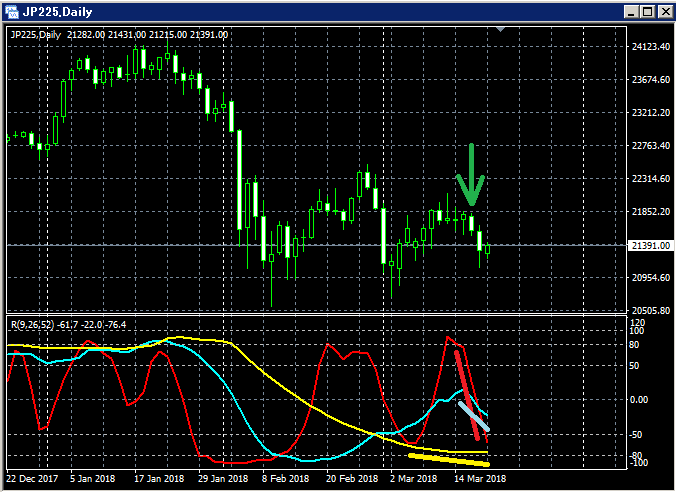
Upper: BODSOR
Lower: RCI 3-Line (Red: RCI9, Light Blue: RCI26, Yellow: RCI52)
The green arrows indicate the March 16 candlestick. At the time this candlestick closed,
the daily RCI 3-Line all lined up for a decline. Price on the daily could be in a strong down-move phase.
Therefore, we check whether on the next trading day, March 19, there was a 1-hour timeframe setup for a rebound sell.
to see if such a situation existed.
The figure below shows the Nikkei 225 futures 1-hour chart from March 15 to 20.
Nikkei 225 Futures 1-Hour
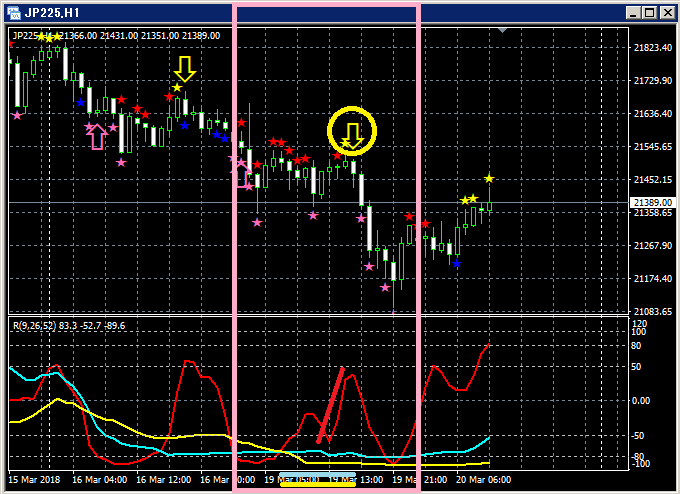
Upper:BODSOR
Lower: RCI 3-Line (Red: RCI9, Light Blue: RCI26, Yellow: RCI52)
From the upper chart, on March 19 the “RCI3-Line + BODSOR”
typical rebound sell signal (yellow arrow) is lit up.
Only RCI9 is rising among the three RCI lines.
If RCI9 reverses downward, all three RCIs may align for a decline.
In other words, price could drop sharply.
In such a situation,BODSOR rebound sell signal (yellow arrow) lights up.
Right after BODSORsignal lights up, three consecutive bearish candles occur. Since price continues to fall thereafter, this case shows the rebound sell signal is working well.
(In this case, waiting for the reversal of RCI9 would cause a delay of two bearish candles.)
Indicator showing Buy on Dip / Rebound Sell Signals【BODSOR】
Twitter
https://twitter.com/RCIX3Line
Blog
http://bodsor.blog.fc2.com/
Investment Navi+
https://fx-on.com/navi/serial/?id=359


