

Pattern aiming to shift from a strong downtrend to an uptrend
RCI 3-LineandBODSORusage examples
One of the features of RCI 3-line (RCI9, RCI26, RCI52) is
“When the three RCI lines align in the same direction, the price movement in that direction becomes large.”
There is such a phenomenon.
If RCI26 and RCI52 are rising (falling) and RCI9 is falling (rising),
when RCI9 reverses,“the three RCI lines align and move in the same direction”will be the case.
Therefore, detecting when RCI9 reverses becomes extremely important.
(Case by case, but simply waiting for a confirmed reversal of RCI9 often leads to a large delay.)
To detect as early as possible the timing when RCI9’s upward (downward) momentum weakens, BODSOR was developed.
The figure below is the AUD/JPY 1-hour chart from March 19.
AUD/JPY 1-hour
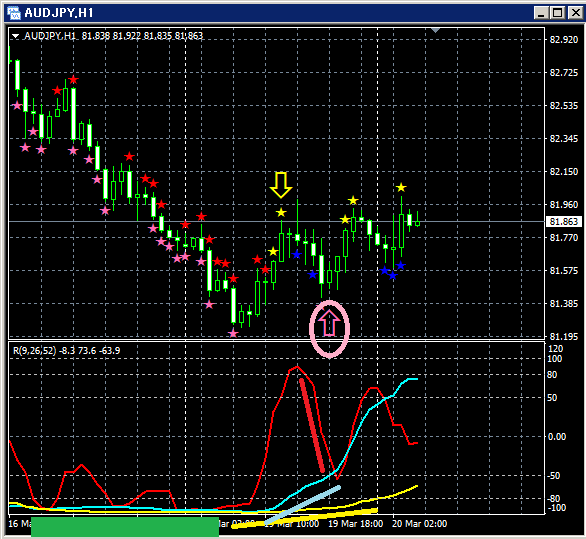
Top: BODSOR
Bottom: RCI 3 lines (red: RCI9, light blue: RCI26, yellow: RCI52)
Note: The above image includes, for explanation, a green, red, light blue, and yellow square, yellow circle marks, and straight lines (red, light blue, yellow).
Please be aware of these additions for illustration purposes.
Buy on dip signal (pink arrows in circles)
First, in the green square area, RCI26 and RCI52 are pressed downward, forming a strong downtrend.
This is a pattern intended to catch the breakout after that trend reverses.
Confirm that RCI26 clearly turns upward.
Confirm that there are signs of an increase in RCI52.
Only RCI9 is clearly decreasing.
If RCI9 reverses upward, all three RCI lines may rise together.
In other words, price may also experience a strong rise.
In such a situationBODSOR’s buy-on-dip signal lights up. Four consecutive bullish candles occur immediately afterward.
Right after the BODSORsignal lights up, four bullish candles occur in a row. In this case, the buy-on-dip signal
works well.
Indicator that displays BUY ON DIP / SELL ON RALLY signals【BODSOR】
Twitter
https://twitter.com/RCIX3Line
Blog
http://bodsor.blog.fc2.com/


