

Check the basic pattern from selling short to taking profit on AUD/JPY 15-minute chart
Three-line RCIandBODSORusage examples
One of the characteristics of the three-line RCI (RCI9, RCI26, RCI52) is
“When all three RCI lines are aligned in the same direction, the price movement in that direction tends to be larger.”
This is one of the features.
If RCI26 and RCI52 are rising (or falling) while RCI9 is falling (or rising),
and RCI9 reverses,“All three RCIs align in the same direction”will be the case.
Therefore, detecting when RCI9 will reverse becomes very important.
(Case by case, but simply waiting for a confirmed reversal of RCI9 often causes significant delays.)
To detect as early as possible the timing when the momentum of RCI9's rise (or fall) weakens
, BODSOR was developed.
The figure below shows last week’s AUD/JPY 15-minute chart (from March 13 to 14).
AUD/JPY 15-minute chart
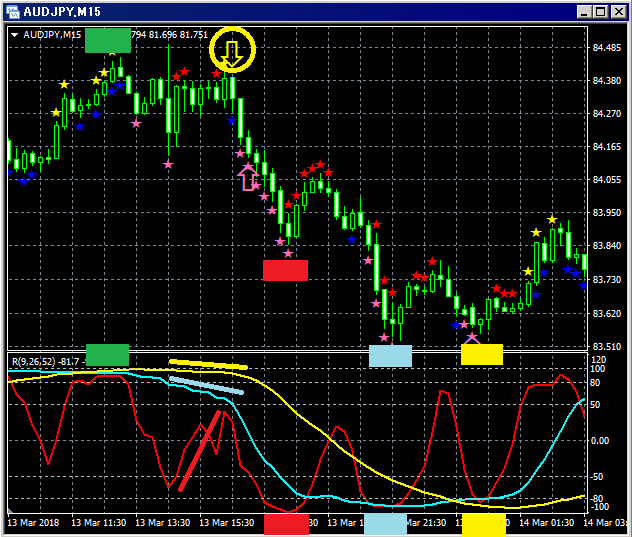
Upper panel:BODSOR
Lower panel: Three-line RCI (red: RCI9, light blue: RCI26, yellow: RCI52)
Note: for explanation, the diagram includes boxes (green, red, light blue, yellow), yellow circle marks, and straight lines (red, light blue, yellow).
Please note.
Sell continuation signal (yellow arrow in a circle)
First, in the green boxed area, the price rises to a state often called the “three-line RCI ceiling.”
From this state, when RCI9 drops once and then rises again,
the sell continuation is a very common pattern.
Only RCI9 among the three lines is rising.
If RCI9 reverses and falls, all three RCIs may align for a decline.
In other words, price may also fall strongly.
In this kind of situation,BODSOR’s sell continuation signal (yellow arrow) lights up.
Immediately after the BODSOR signal lights up, there are eight consecutive bearish candles. After that, price continues to decline, so in this case the sell continuation signal functions well.Possible take-profit points include:(1) Point where only RCI9 has fallen to the downside (red rectangle)(2) Point where both RCI9 and RCI26 have fallen (light blue rectangle)(3) Point where all three RCIs have fallen (yellow rectangle)and so on.Indicator displaying pullback buying and sell continuation signals [BODSOR]Twitterhttps://twitter.com/RCIX3LineBloghttp://bodsor.blog.fc2.com/
Possible take-profit points include:
(1) Point where only RCI9 has fallen to the downside (red rectangle)
(2) Point where both RCI9 and RCI26 have fallen (light blue rectangle)
(3) Point where all three RCIs have fallen (yellow rectangle)
and so on.
Indicator displaying pullback buying and sell continuation signals [BODSOR]
Twitter
https://twitter.com/RCIX3Line
Blog
http://bodsor.blog.fc2.com/


