

Confirm common patterns of selling rallies on the USD/JPY daily chart
RCI Three-LineandBODSORUsage Examples
One of the characteristics of the three-line RCI (RCI9, RCI26, RCI52) is
“When the three RCIs line up in the same direction, the price movement in that direction tends to be stronger.”
This is one of the features.
If RCI26 and RCI52 are rising (falling) while RCI9 is falling (rising),
when RCI9 reverses,“the three RCIs line up in the same direction”This is what happens.
Therefore, detecting when RCI9 will reverse is very important.
(Case by case, but simply waiting for a confirmed reversal of RCI9 often leads to significant delays.)
To detect as early as possible the timing when the momentum of RCI9 to rise (or fall) weakens,
BODSOR was developed.
The figure below shows the USD/JPY daily chart from around November 2016 to around April 2017.
USD/JPY Daily
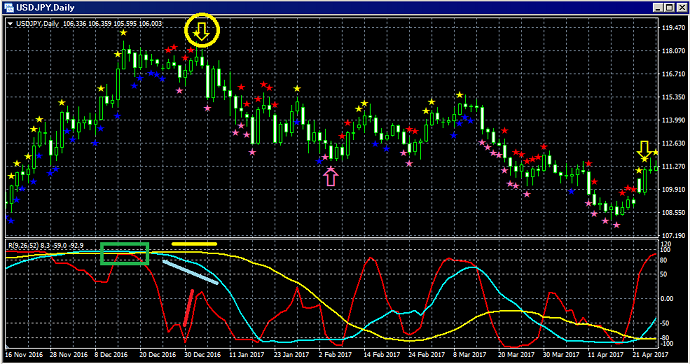
Top: BODSOR
Bottom: Three-line RCI (red: RCI9, light blue: RCI26, yellow: RCI52)
Rebound Sell Signal (yellow arrows encircled)
First, in the green-encircled area, the state called the “RCI triple top” rises to a peak.
From this state, when RCI9 briefly declines and then rises again,
many traders target a rebound sell at that point.
Among the three-line RCIs, only RCI9 is rising.
If RCI9 reverses and falls, all three RCIs may align for a downward move.
In other words, the price could drop steeply.
In this situation,BODSORrebound-sell signal (yellow arrows) lights up.
Right after the BODSORsignal lights up, two consecutive bearish candles appear. Since the price continues to fall afterward, in this case the rebound-sell signal works well.
Indicator displaying pullback-buy/rebound-sell signals [BODSOR]
Twitter
https://twitter.com/RCIX3Line
Blog
http://bodsor.blog.fc2.com/


